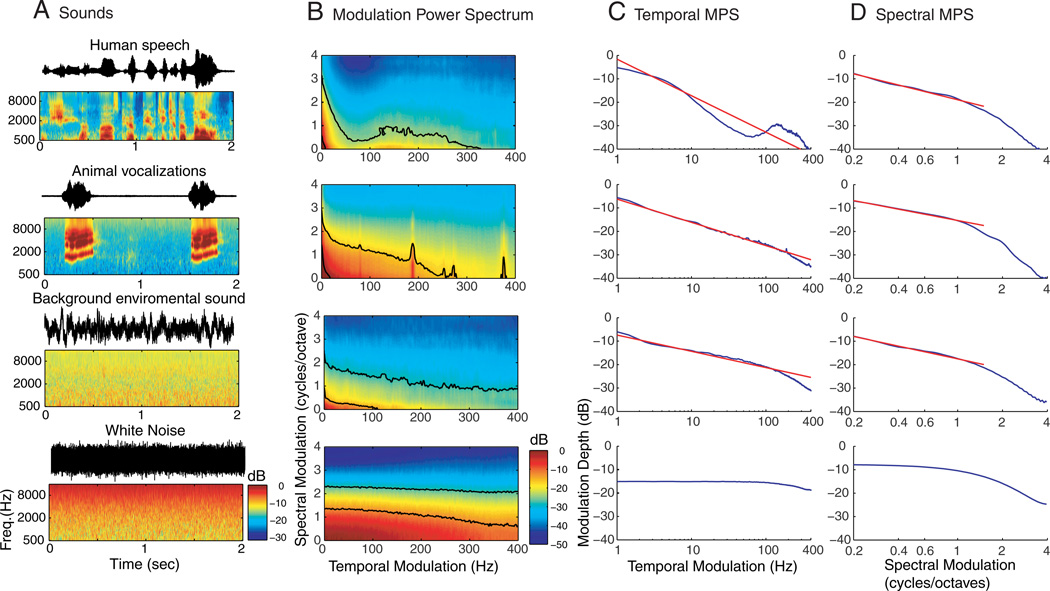
Figure 2.
Ensemble characteristics of natural sounds. Natural sounds waveforms (A, black waveforms) were decomposed by an auditory filterbank model into a spectrotemporal representation (A, color panels) that depicts the sound power as a function of time and frequency. Representative 2 s segments from speech (male speaker; “If she unmask her beauty to the moon.”), an animal vocalization (wild cat; Felis herpailurus yaguarondi), background sound (rain), and white noise (top to bottom). For vocalizations the sound power is coherently modulated over frequency and time, whereas for background sounds and white noise the modulations are random. For white noise the power at high frequencies is accentuated because the auditory filterbank bandwidths are larger for higher frequencies. B, The MPS depicts the signal power as a function of temporal and spectral modulation frequency. Black contours in the MPS denote the modulation space that accounts for 90% and 50% of the MPS power. For all three natural sounds, a tradeoff between temporal and spectral modulations is observed. C, D, The temporal and spectral modulation power spectrum was obtained by decomposing the MPS into its strictly spectral and temporal components (see Materials and Methods). A strong decrease in the modulation power of all natural sounds approximates a power law function (straight line on a doubly logarithmic plot). A comparable decrease in the modulation power is not observed for white noise. Red curves in C and D designate the optimal-fit power law.

