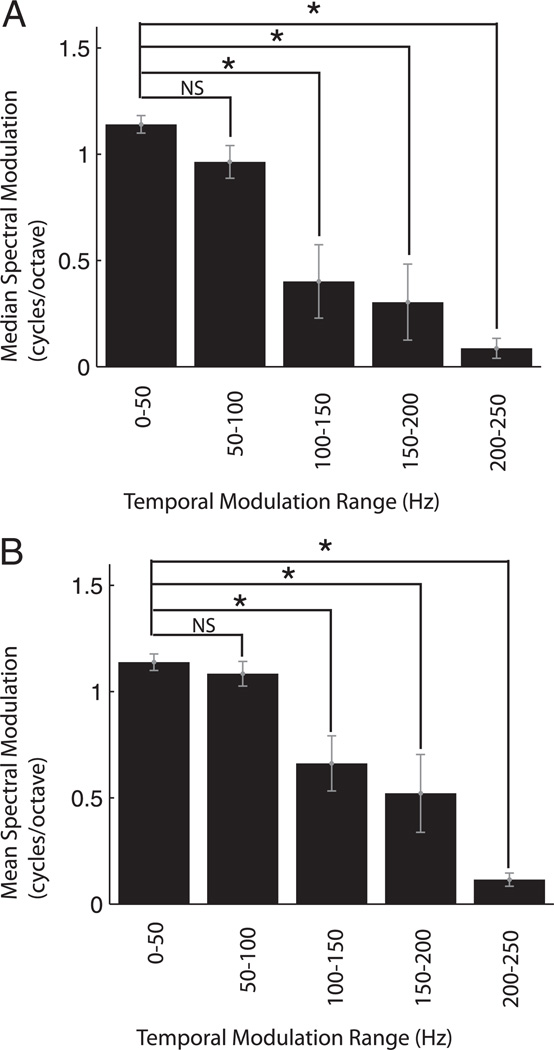
Figure 4.
Modulation tradeoff statistics.A,B, Median (A) and mean(B) cSMF as a function of cTMF range. The neural ensemble was partitioned into nonoverlapping cTMF ranges (0 – 50, 50 – 100, 100 – 150, 150 – 200, 200 – 250 Hz). Both the median and mean cSMF decreased systematically with increasing cTMF range. Error bars designate the bootstrapped SE and * designates significant results (median, Wilcoxon rank-sum, p < 0.05 with Bonferroni correction; mean, paired t test, p < 0.05 with Bonferroni correction).

