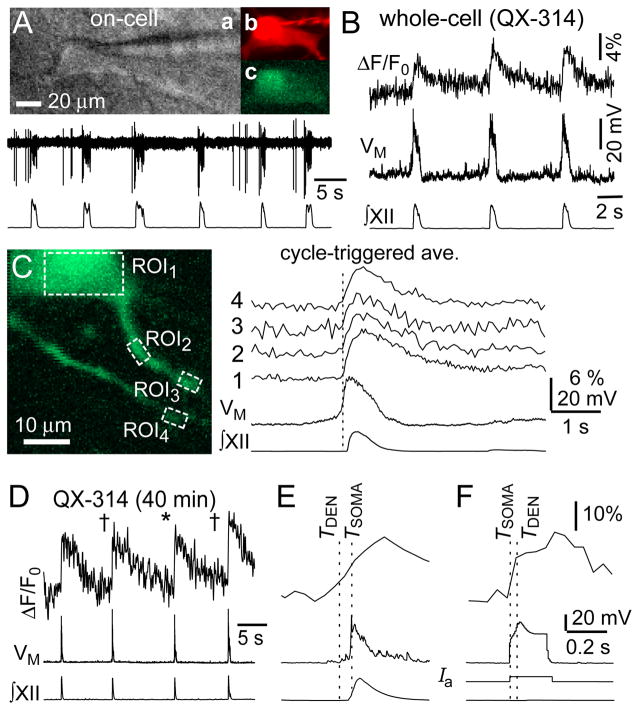
Figure 1.
Ca2+ measurements in preBötC neurons recorded with QX-314. A, IR-DIC videomicroscopy (a), Alexa 568 (b), and OGB-2 (c) images with on-cell recording (upper) and XII output (lower). B, imaging and electrophysiology from cell in A. C, cycle-triggered average of Ca2+ and membrane potential from cell in A,B. Vertical line indicates inspiratory onset. Numbered traces correspond to ROIs in the image. D, in a different cell, dendritic imaging 91 μm from the soma. Cycles marked with † show positive dendritic Ca2+ latency, cycle marked with * shows negative drive latency. E, cycle marked * displayed at higher sweep speed. F, dendritic and somatic responses to current injection. Broken lines indicate the TDEN and TSOMA.

