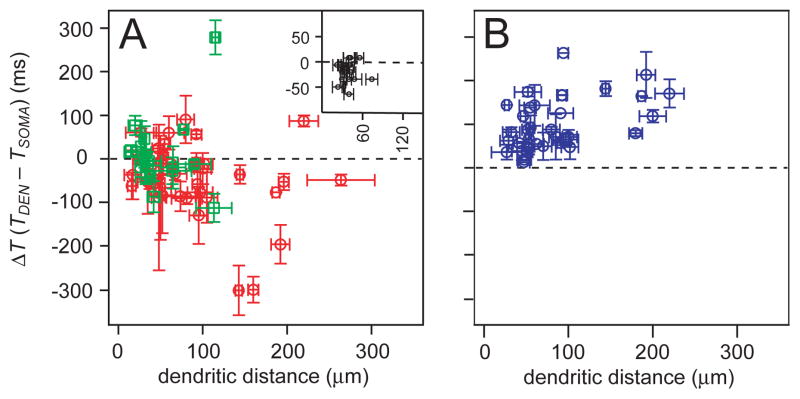
Figure 3.
Plots of dendritic Ca2+ latency versus recording distance for the entire data set. A, Drive latency for endogenous cycles of respiratory activity (red shows K-Gluconate recordings, green shows QX-314 experiments). Inset reproduces Fig. 2K. B, Dendritic Ca2+ latency in response to step commands (blue). Vertical error bars correspond to standard error of ΔT. Horizontal error bars indicate the length of the dendritic ROI.

