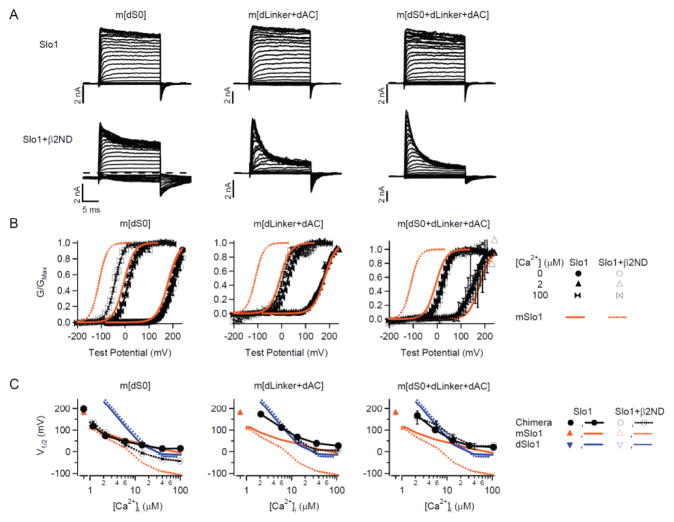
Figure 4. Effects of the N-terminus and the C-Linker/AC region of dSlo1 in mSlo1 background on the β2ND modulation of Ca2+ sensitivity.
A, Macroscopic currents of m[dS0], m[dLinker+dAC] and m[dS0+dLinker+dAC] with and without β2ND at ~100 μM [Ca2+]i. Voltage pulses are from −200 to 200 mV with 10 mV increments, and the repolarizing potentials is −50 mV except for m[dS0] and m[dLinker+dAC] with β2ND, which is −80 mV. The dashed line represents the zero current line for each current trace. B, G-V relations of chimeras compared with that of mSlo1 (orange) at low (0, ~2 or ~10 μM) and ~100 μM [Ca2+]i. Due to apparent inactivation of the channels, the G-V relations were measured from both the peak currents and tail currents, and both methods resulted in the same V1/2. C, V1/2 vs. [Ca2+]i plots of chimeras compared with that of mSlo1 and dSlo1 with and without β2ND. The number of patches for each data are: for the following ~(μM) [Ca2+]i, 0, 1, 2, 5, 10, 30, 100, m[dS0]: 9, 6, 4, 4, 4, 4, 6; m[dS0]+β2ND: 4, 3, 3, 4, 3, 5, 7; m[dLinker+dAC]: 0, 0, 7, 14, 15, 6, 20; m[dLinker+dAC]+β2ND: 0, 0, 0, 0, 4, 5, 20; m[dS0+dLinker+dAC]: 0, 0, 5, 4, 4, 4, 14; m[dS0+dLinker+dAC]+β2ND: 0, 0, 2, 3, 4, 2, 9.

