
Figure 8. Dependence of the β1 and β2 modulation of Ca2+ sensitivity on Ca2+ binding sites in mSlo1.
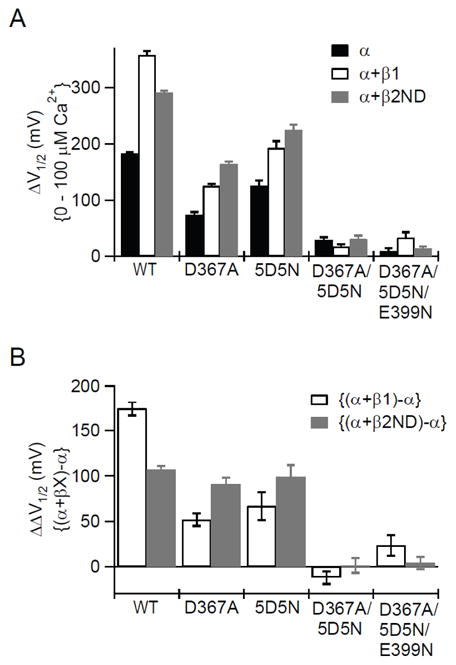
A, Bar graph of the G-V shift in response to a [Ca2+]i change from 0–100 μM of WT (wild type), single Ca2+ binding site mutations (D367A and 5D5N), double Ca2+ binding site mutation (D367A/5D5N) and double Ca2+ binding site plus the Mg2+ binding site mutation (D367A/5D5N/E399N) without (black) and with β1 (unfilled) or β2ND (gray). B, Differences in ΔV1/2 from panel A of β1 (unfilled) and β2ND (gray) with WT, single, double and triple binding site mutations. The number of patches for each data are: for ~0 and ~100 μM [Ca2+]i: mD367A: 10, 9; mD367A+β1: 9, 9; mD367A+β2ND: 5, 7; 5D5N: 6, 11; 5D5N+β1: 8, 9; 5D5N+β2ND: 4, 8; mD367A/5D5N: 14, 6; mD367A/5D5N+β1: 6, 5; mD367A/5D5N+β2ND: 5, 5; mD367A/5D5N/E399N: 15, 15; mD367A/5D5N/E399N+β1: 5, 9; mD367A/5D5N/E399N+β2ND: 8, 12.