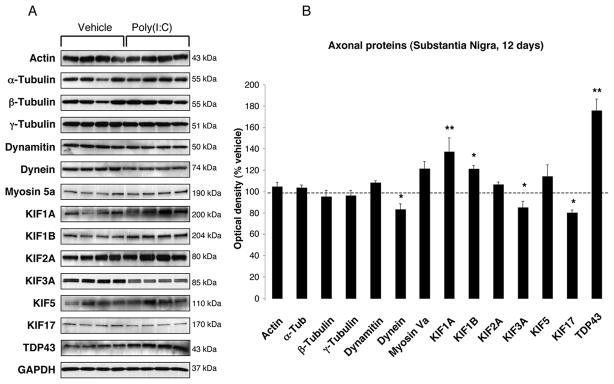
FIGURE 3. Nigral changes in the levels of axonal proteins at 12 days after poly(I:C) injection.
(A) Anterograde transport motor proteins (KIF1A, KIF1B) were increased, whereas KIF3A, KIF17 and dynein were decreased. Levels of TDP-43 were increased. (B) Optical densities of the individual bands were quantified using NIH ImageJ. Optical densities were normalized by the averaged value of GAPDH and expressed as percentage of vehicle-injected conditions. Data are shown as mean ±SEM (Vehicle, n=9; poly(I:C), n=10; * p<0.05, ** p<0.01 unpaired t-test).

