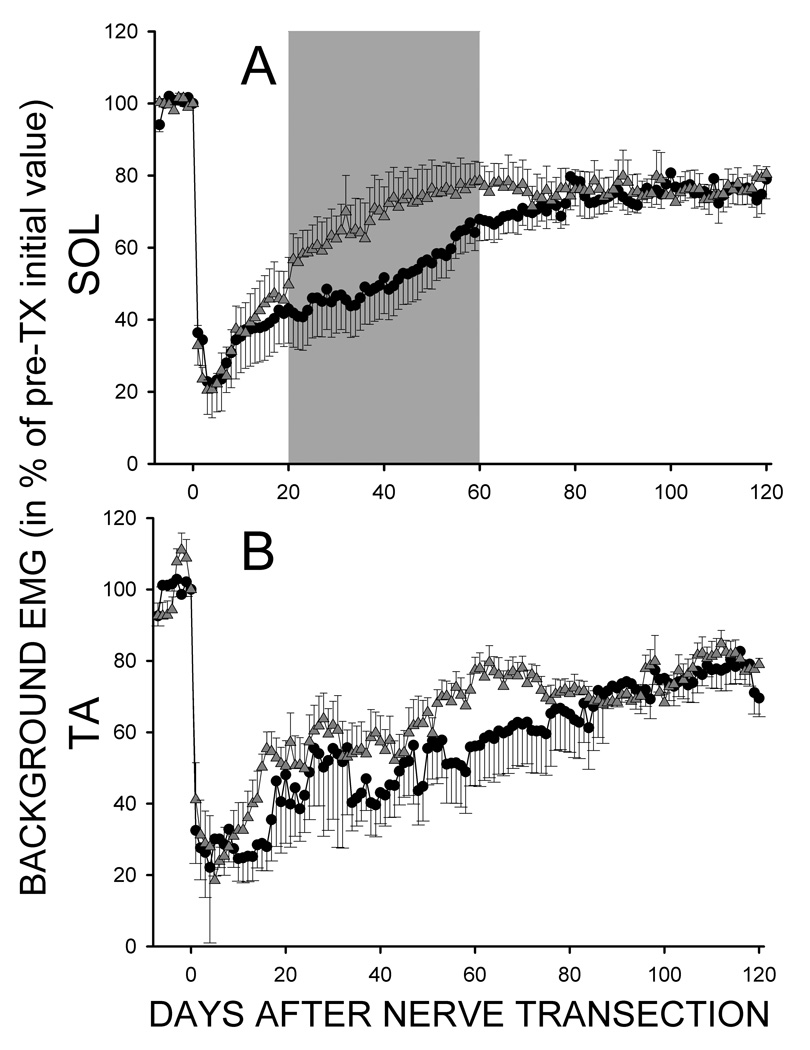
Figure 5.
A: Average (±SEM) daily SOL background EMG (in percent of pre-transection value (i.e., average of final 7 days before the sciatic nerve transection)) for the five TC (black circles) and eight TU (gray triangles) rats for 7 days before and 120 days after transection. The difference between TC and TU groups was significant (P<0.05, ANOVA) for Days 21–40 and 41–60 (shaded area). B: Average (±SEM) daily TA background EMG (in percent of pre-transection value) for 4 TC (black circles) and 6 TU (gray triangles) rats for 7 days before and 120 days after nerve transection. No significant difference was detected.

