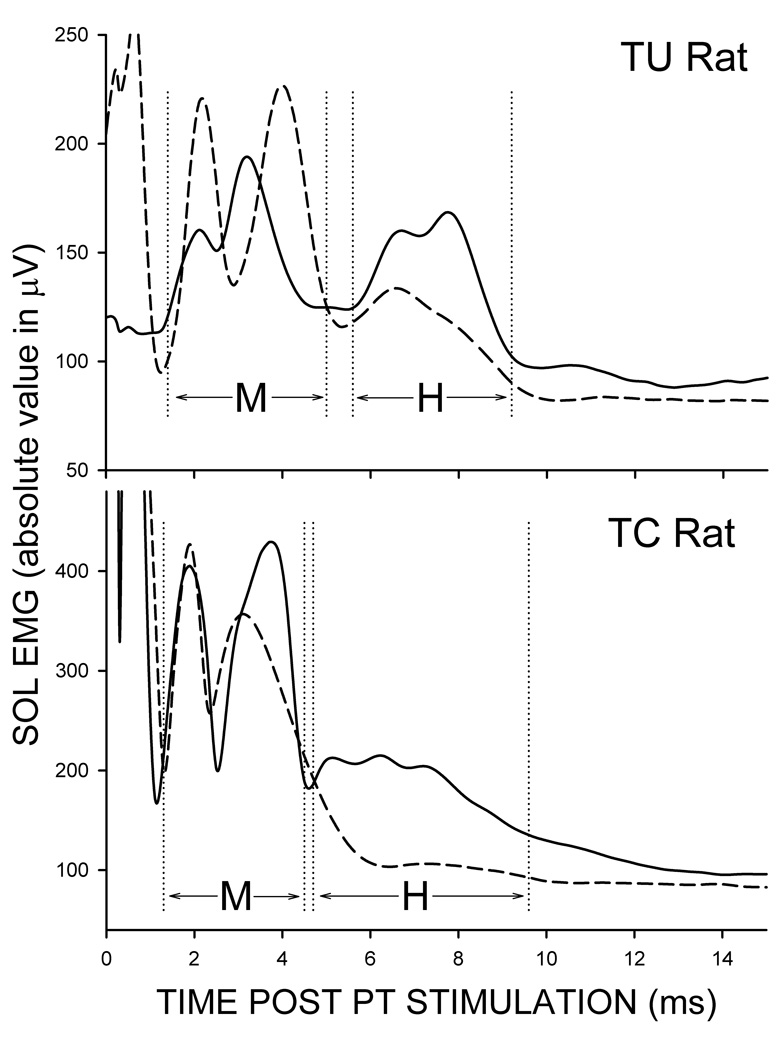
Figure 7.
Average post-stimulus SOL EMG activity for the final seven days before nerve transaction (solid line) and for post transection days 111–120 (dashed line) from a TU rat (top) and a TC rat (bottom). The M response has recovered similarly in the two rats. In contrast, the H-reflex has recovered better in the TU rat than in the TC rat. Note that the M and H latencies, marked by vertical dashed lines, differ slightly in these two rats. Peaks in the first 1–2 ms after stimulation are stimulus artifacts.

