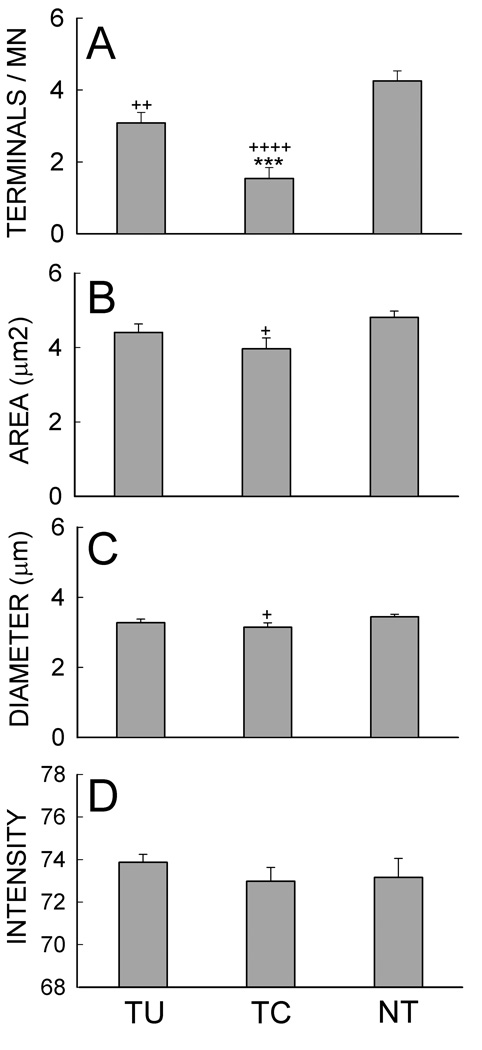
Figure 9.
Average (±SE) numbers of VGLUT1 terminals per motoneuron (A), terminal areas (B), terminal diameters (C), and terminal VGLUT1-IR intensities (D) for TU, TC, and NT rats. +, ++, ++++: P<0.05, P<0.005, and P<0.00001, respectively, for TU or TC vs. NT rats; ***: P<0.001 for TU vs. TC rats by ANOVA.

