
Figure 5. MPF and MAPK kinetics.
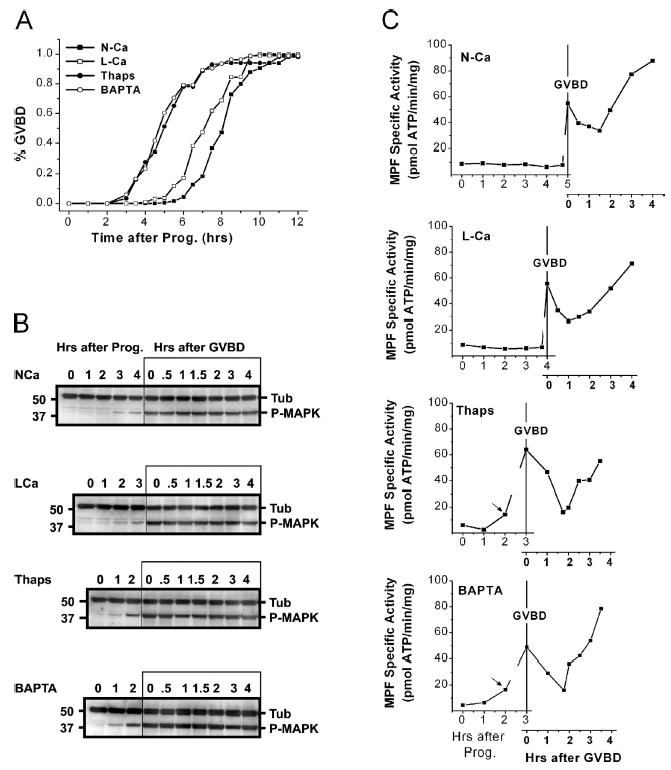
(A) GVBD time course for oocytes incubated in N-Ca, L-Ca, or treated with 2 μM of thapsigargin for 3 h or injected with 500 μM BAPTA. (B and C) Phos-pho-MAPK (P-MAPK; B) and MPF activity (C) in the different treatments. At each time point as indicated, lysates were assayed for P-MAPK levels using an anti–P-MAPK specific antibody, and for MPF levels measured as histone H1 kinase activity. MAPK and MPF assays were performed on the same lysate. For P-MAPK Western blots were also probed for α-tubulin (Tub) to provide a loading control. The time course is divided into two phases: (1) after progesterone addition and (2) after GVBD. The 50 and 37 molecular weight markers are shown on the left of each gel. These data are representative of three similar experiments.