
Figure 1.
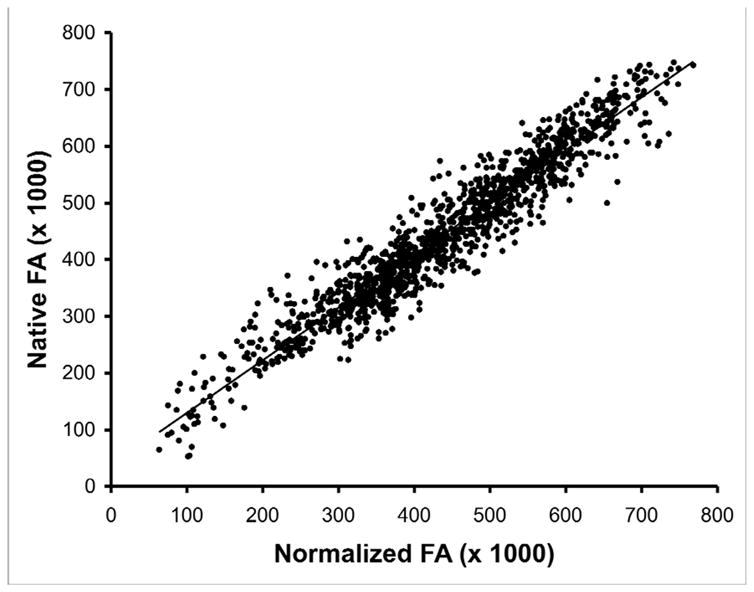
Scatter plot of fractional anisotropy (FA) values for from a normal control subject in normalized space (x-axis) and native space (y-axis). Normalization was achieved by application of12 parameter affine transformation followed by an elastic (non-linear) deformation to achieve a closer match to the template image. The inverse transformation was used to convert normalized space back to native space. FA values were extracted from a 10×10×10 voxel cube in both normalized and native volumes.