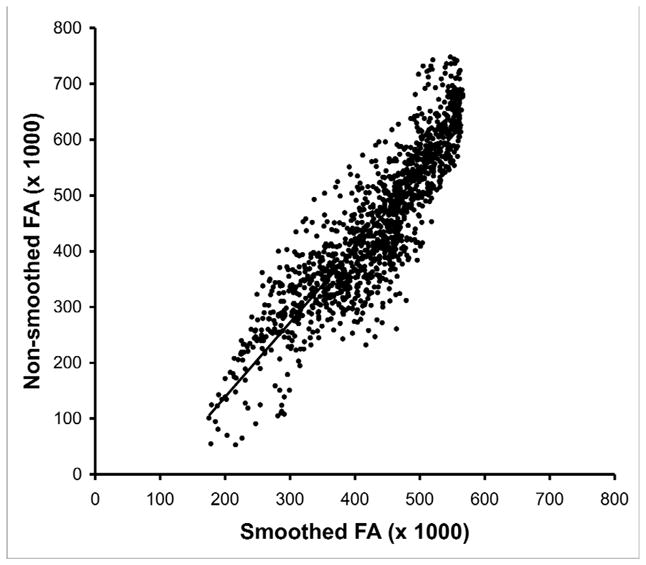
Figure 2.

Scatter plot of fractional anisotropy (FA) values from a normal control subject smoothed with a 8mm full-width-half-maximum Gaussian kernel (x-axis) and non-smoothed (y-axis). Smoothed and non-smoothed FA values were extracted from a 10×10×10 voxel cube. Note distortion (shifting of extreme values towards the mean) at high and low values of FA.
