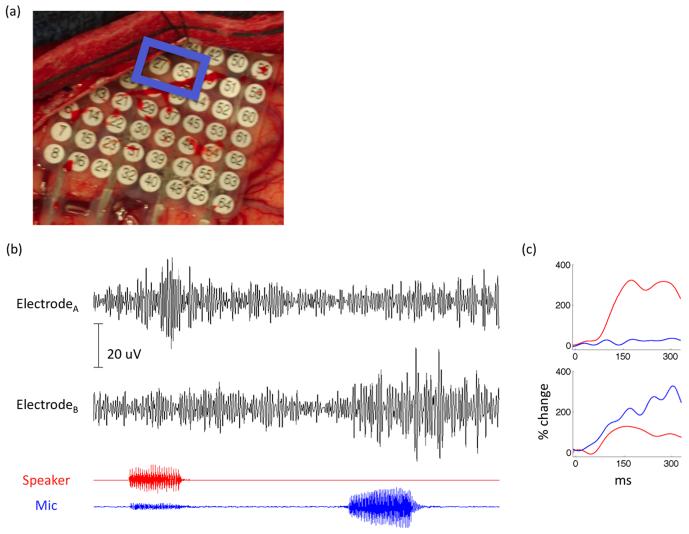
Figure 6.
(a) Intraoperative image of a high-density 4 mm electrode grid. (b) High frequency oscillatory responses are shown for two adjacent electrodes during a 2 second epoch (raw traces filtered at 70-150 Hz). Electrode A responds selectively to external stimuli (speaker plotted in red) while Electrode B responds predominantly to self-produced speech (microphone plotted in blue). (c) Averaged event related power changes locked to hearing (red) and speaking (blue) stimuli in the two adjacent electrodes.

