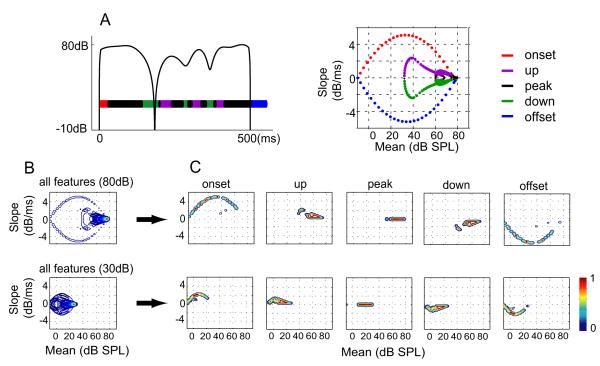
Figure 1. Envelope features of the aAM stimuli.
(A) Envelope of an aAM stimulus with a peak level of 80dB SPL (left) and its mean-slope trajectory (right). Envelope segments with positive, zero, and negative slope values and their associated mean-slope trajectories are plotted in different colors. Each color dot on the mean-slope trajectory marks the mean-slope values of one 25-ms envelope segment. (B) Contour plots of the mean-slope distributions of total envelope features in ten aAM stimuli played at 80dB and 30dB SPL. (C) Contour plots of the mean-slope distributions of five envelope feature types at 80dB and 30dB SPL. The color of a contour line indicates the peak-normalized magnitude of a distribution.

