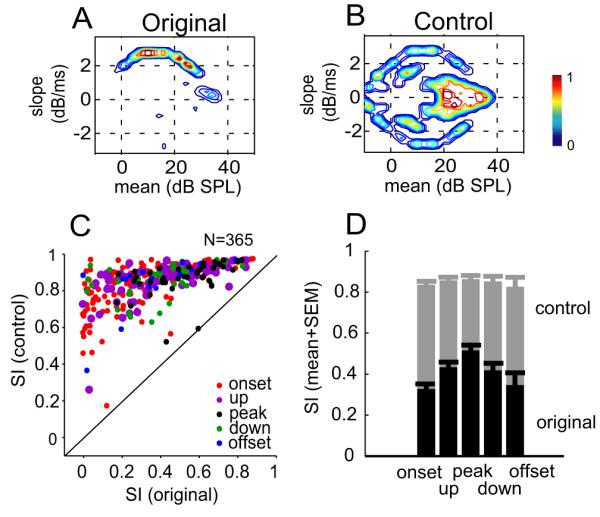
Figure 4. Envelope slope sensitivity of neurons in auditory cortex.

Original (A) and control (B) feature maps of an example neuron. Highly asymmetric activity was observed in the original map, but not in the control obtained from shuffled spike times. (C) Scatter plot of Symmetry Index (SI) in the original (abscissa) and in the control map (ordinate) for all neurons tested. Different preferred envelope feature types are labeled in different colors. (D) SI values (mean+SEM) of the original (black) and control (gray) feature maps for each feature type.
