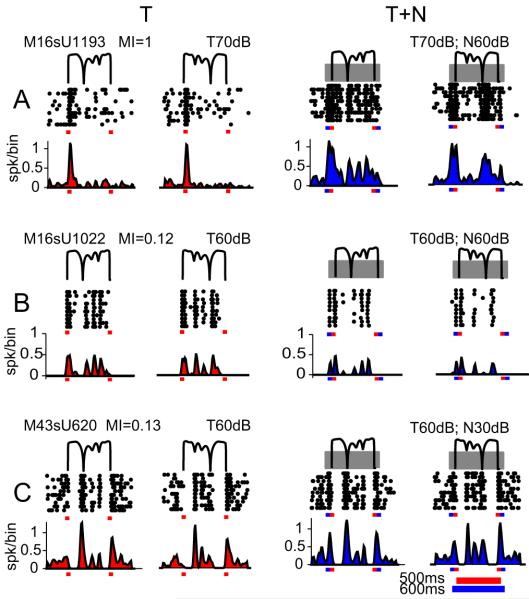
Figure 5. Spike-timing patterns to aAM envelope in background noise.
(A)-(C) Raster plots and PSTHs of responses of three neurons in T and T+N conditions. The envelopes of two aAM stimuli (forward and time-reversed) are shown in thin black lines above the raster plots. The MI value of a neuron and the SPLs of aAM and noise are indicated above the stimuli. To provide a visible reference for the noise responses, we intentionally chose these neurons showing excitatory responses to the noise onset. In the T+N condition, the broadband noise (depicted as gray blocks overlaying the aAM stimuli) was gated on 50 ms before the aAM onset and gated off 50 ms after the aAM offset. The onset and offset times are indicated by tick marks on each panel (aAM in red and noise in blue). Each aAM waveform lasted 500 ms and noise lasted 600 ms. The binwidth used for PSTHs was 10 ms.

