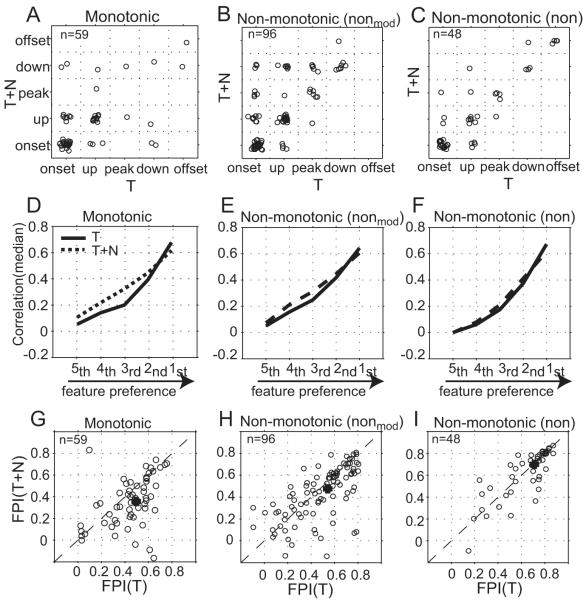
Figure 6. Comparison of envelope feature selectivity in background noise.
(A)-(C) Scatter-plot of the preferred feature types of monotonic, moderately non-monotonic and highly non-monotonic neurons tested in both T and T+N conditions. Each circle designates the preferred envelope types of one neuron with and without background noise in response to the same aAM stimuli. The median noise level was 40dB SPL for all three neuronal populations. For the purpose of plotting, the five feature types were numbered from 1 to 5. For example, the onset-onset transition was positioned (1,1) on the x-y plane. To visually separate the circles within each subgrid, we jittered the position of each circle by adding a small Gaussian random number (mean=0 and SD=0.1) to its numerical feature type. (D)-(F) Correlation coefficient (median) between stimulus-response feature maps in T and T+N conditions. Data are presented in the same format as those in Fig. 3C. (G)-(I) Scatter-plot of FPI values between T and T+N conditions for individual neurons. The median FPI value is marked by a cross sign on each panel.

