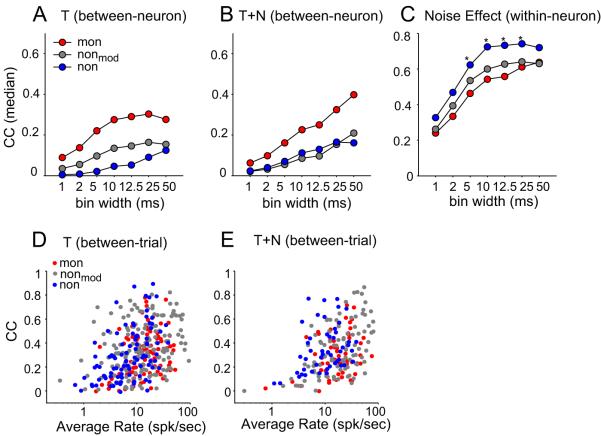
Figure 7. Correlation analysis of spike-timing patterns in response to aAM stimuli.
(A)(B) The Pearson correlation coefficient (CC, median) of the between-neuron comparison in T and T+N conditions. (C) The Pearson correlation coefficient (CC, median) of the within-neuron comparison between T and T+N conditions. In A-C, the spike times were binned at multiple resolutions ranging from 1 to 50 ms. Due to the temporal smoothing effect of a spike counting window, the correlation computed from PSTHs increased with the binwidth. (D)(E) The Pearson correlation coefficient (CC) of the between-trial comparison as a function of average rate in T and T+N conditions. Each circle represents data from one neuron, averaged over CCs from all pair-wise correlations between different trials of responses. The PSTH binwidth was 10ms. The total numbers of PSTHs (i.e., test conditions) used in T and T+N conditions are listed in Table I.

