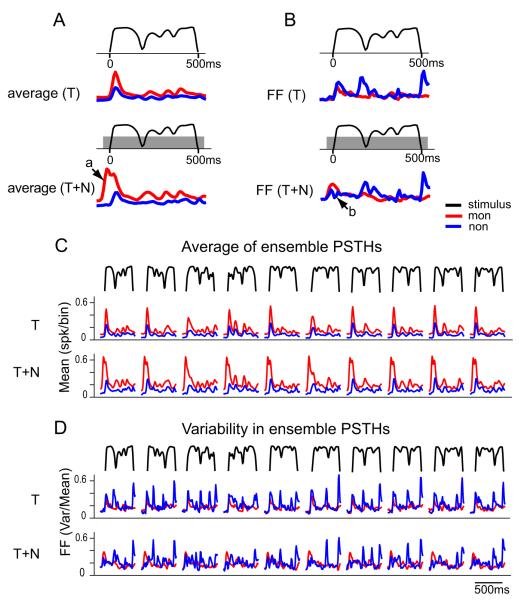
Figure 8. aAM envelope representation by a population of neurons.
(A) Average and (B) FF of ensemble PSTHs for monotonic (red) and highly non-monotonic neurons (blue) in response to an aAM envelope in T and T+N conditions. (C) Average and (D) FF of ensemble PSTHs to the ten aAM envelopes in T and T+N conditions. The aAM duration was 500 ms and noise duration was 600 ms. The PSTHs show responses occurring from 100 ms before the aAM onset to 50 ms after the aAM offset (spike times were advanced 15 ms in data analyses). The PSTH binwidth was 10 ms. The ensemble sizes in T and T+N conditions were the same as those in Fig. 7.

