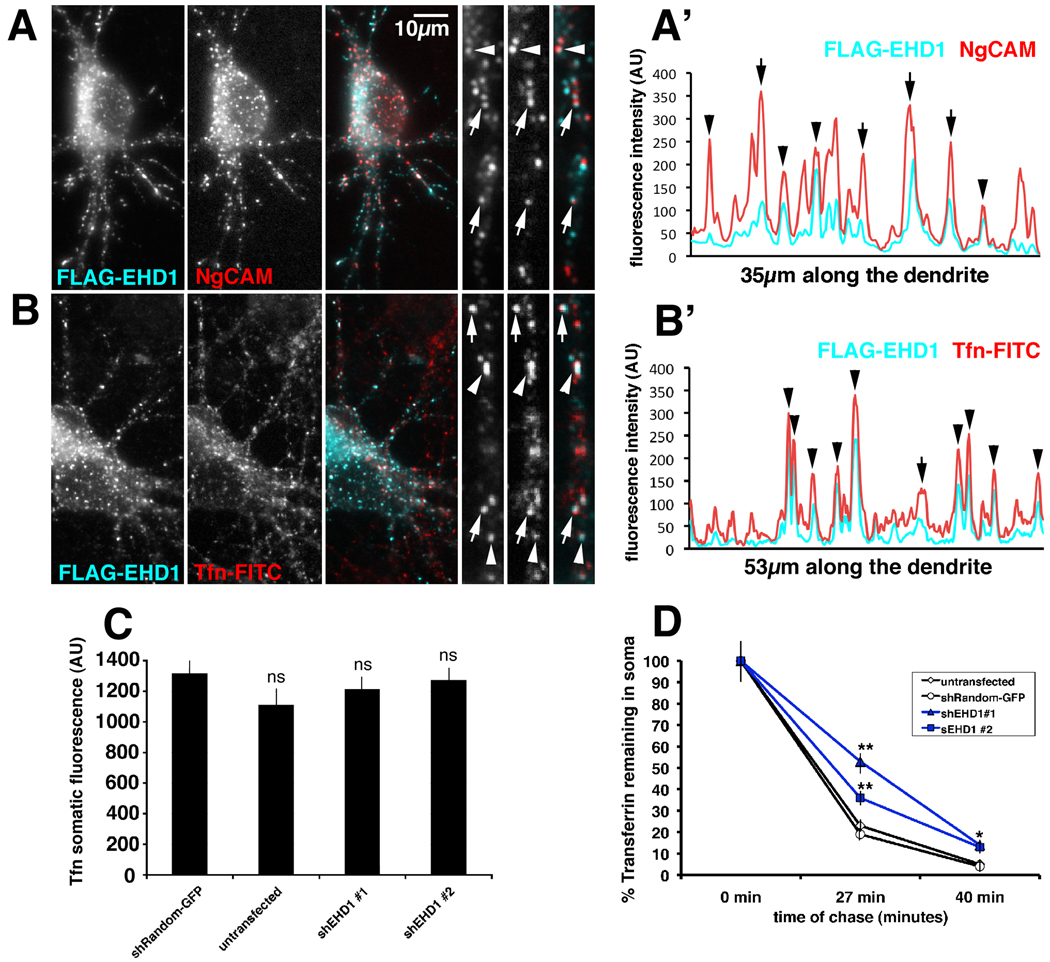
Figure 1. EHD1 co-localizes with endocytosed NgCAM and transferrin and is important for transferrin recycling.
(A) Neurons co-expressing FLAG-EHD1 (cyan) and NgCAM (red) were allowed to endocytose anti-NgCAM antibodies for 20 min before fixation. Endocytosed NgCAM was detected with a secondary antibody, whereas FLAG-EHD1 was detected with anti-FLAG rabbit antibody. Single channels as well as overlaid channels (colocalization appears white) are shown for the soma region and part of a dendrite. Scale bar is 10 µm. (A’) Representative intensity line scan of FLAG-EHD1 (cyan) and NgCAM (red) along a dendrite is shown. Endosomes correspond to the peaks on the trace. Overlapping peaks for FLAG-EHD1 and NgCAM indicate colocalization of both markers. (B) Neurons expressing FLAG-EHD1 (cyan) were allowed to endocytose FITC- rat transferrin (red) for 1 hour before fixation. FLAG-EHD1 was detected with anti-FLAG rabbit antibody. (B’) Representative intensity line scan of FLAG-EHD1 (cyan) and transferrin (red) along the dendrite is shown. Precisely co-aligned peaks are marked with arrowheads. Peaks with lateral off-set are marked with arrows. (C) Untransfected neurons or neurons transfected with either shEHD1#1-GFP or shEHD1#2-GFP or shRandom-GFP were allowed to uptake Cy5-rat transferrin for 1 hour. (D) Untransfected neurons (clear rhombus) or neurons transfected with either shEHD1#1 (blue triangle) or shEHD1#2 (blue square) or shRandom (clear circle) were allowed to uptake Cy5-rat transferrin for 1 hour, then unbound transferrin was washed out and bound transferrin was chased for 0 minutes, 27 minutes and 40 minutes. Percent of transferrin retained in soma was measured and normalized to t0. Statistics were performed using student’s t-test. ** p<0.0001, * p<0.01, bar=sem.

