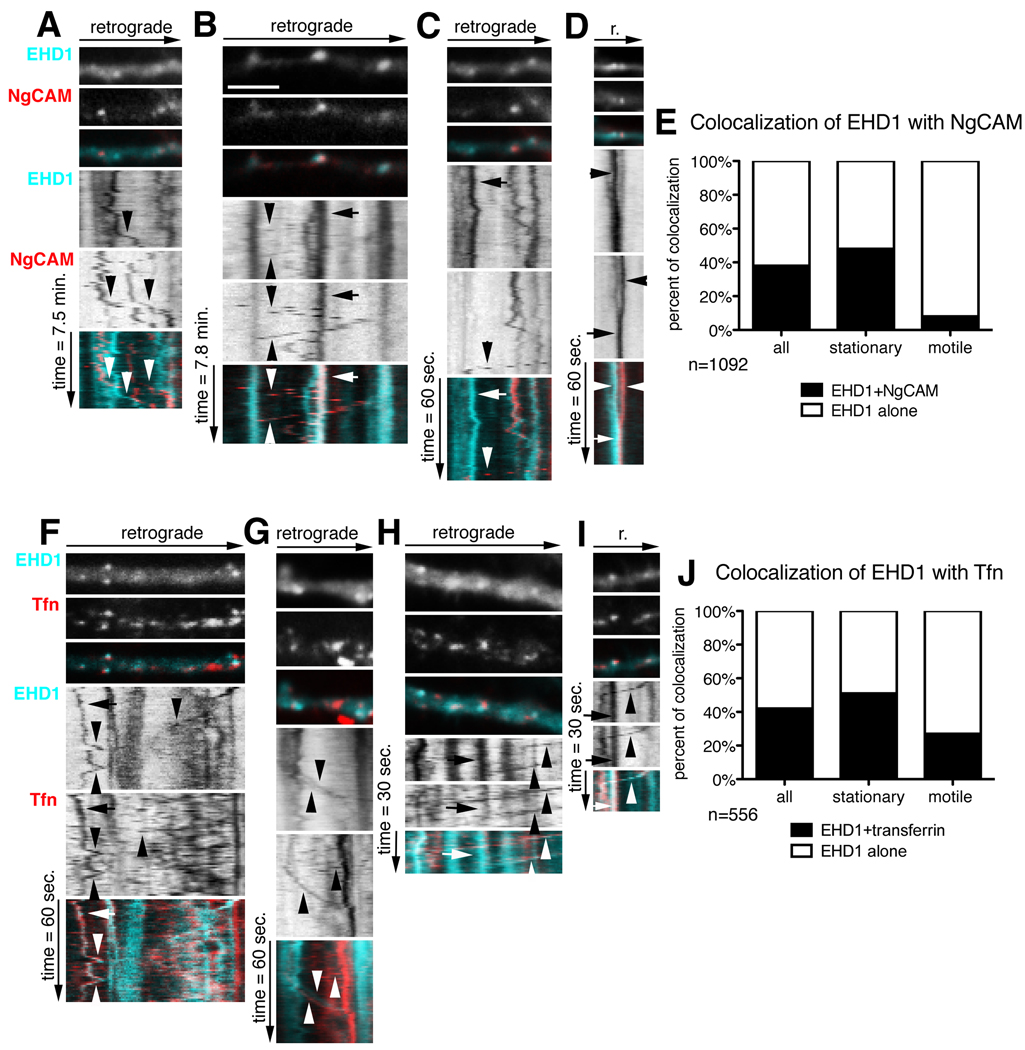
Figure 3. Stationary and motile EHD1 compartments contain endocytosed cargos.
Neurons were transfected with cherry-EHD1 and NgCAM (A–E) or cherry-EHD1 alone (F–J), and endocytosis assays performed 24 hours later. (A–D) Dynamic behavior of cherry-EHD1 (cyan) and endocytosed NgCAM (red) in dendrites. First frame of time-lapse of part of dendrite is shown with the respective kymograph underneath. The time dimension is shown on the y-axis, the retrograde direction is indicated above. Arrows indicate stationary vesicles, arrowheads indicate motile vesicles. Scale is 6µm. Images were captured with 10s frame rate (A, B) and 1s frame rate (C–D). (A) Examples of motile EHD1-positive vesicles and NgCAM-positive vesicles (arrowheads). (B) Example of stationary EHD1- NgCAM-positive vesicle (arrow) and motile vesicle (arrowheads). (C) Example of stationary EHD1-positive vesicle (arrow) and motile NgCAM-positive vesicle (arrowhead). (D) Example of apparent fusion between NgCAM-positive vesicle and EHD1-positive vesicle. (E) Quantification of colocalization and motility of all endosomes (n = 1092) in the 1-min and 10 min imaging period.
(F–I) Dynamic behavior of cherry-EHD1 (cyan) and endocytosed DyLight488 transferrin (red) in dendrites. Images were captured with 1s frame rate (F, G) and 0.5s frame rate (H, I). (F) Examples of motile EHD1-positive vesicles and transferrin-positive vesicles (arrowheads) and stationary EHD1- transferrin- positive vesicle (arrow). (G) Examples of motile EHD1 vesicle, motile Tfn vesicle, and motile EHD1-transferrin-positive vesicle (arrowheads). (H) Example of stationary EHD1- transferrin-positive vesicle (arrow) and motile EHD1- transferrin-positive vesicles (arrowhead). (I) Example of stationary EHD1-transferrin- positive vesicle (arrow) and EHD1- transferrin-positive motile vesicle (arrowhead). (J) Quantification of co-localization and motility of all endosomes (n = 556) in the 1-min and 0.5 min imaging period.

