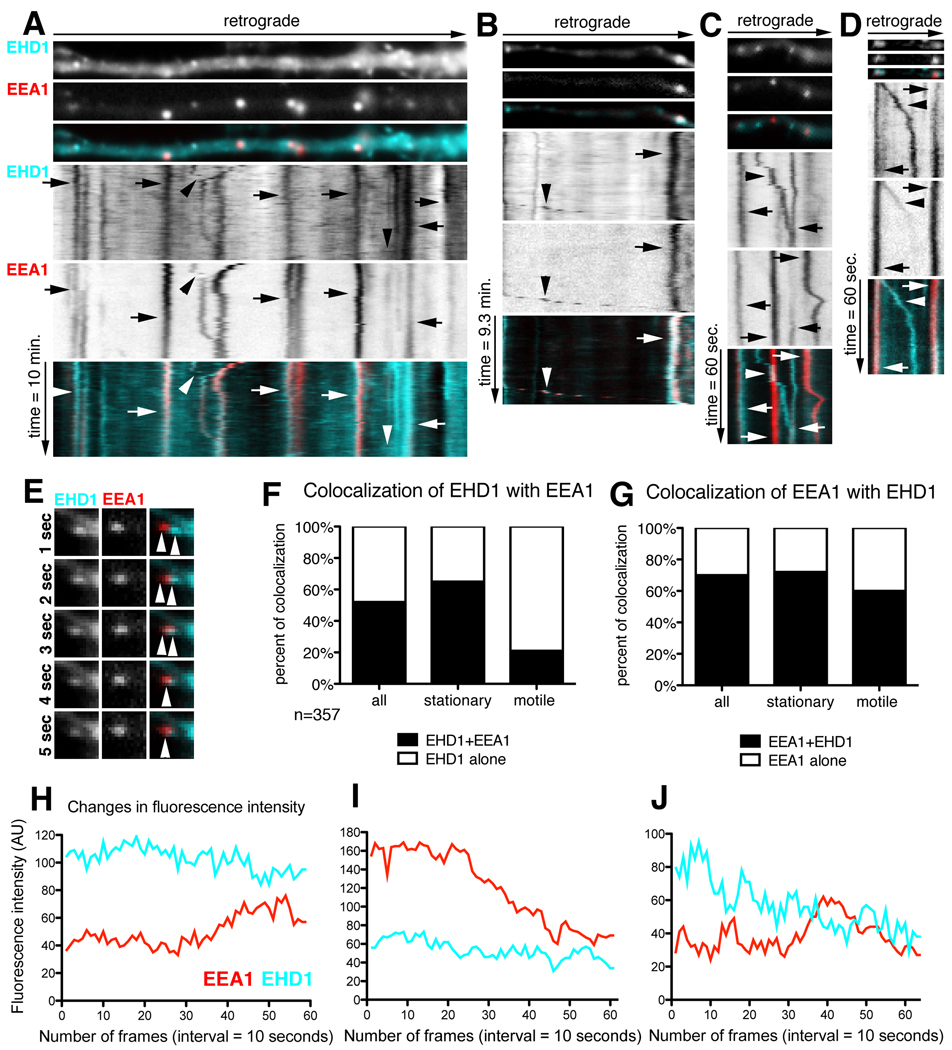
Figure 6. Dynamic co-localization of EHD1 with EEA1-positive early endosomes.
(A–D) Neurons were co-transfected with cherry-EHD1 and GFP-EEA1. Time lapse was performed for 10 minutes duration (A–B) and 1 minute duration (C–D). First frame of time lapse of part of dendrite and kymograph are shown. The time dimension is shown on the y-axis, the retrograde direction is indicated above. (A) General view of dynamic colocalization of cherry-EHD1 (cyan) and GFP-EEA1 (red). Arrows indicate stationary vesicles and arrowheads motile compartments. Scale is 6 µm. (B) Example of stationary (arrow) and motile (arrowhead) EHD1- EEA1-positive vesicles. (C) Example of motile EHD1-positive vesicle (arrowhead), and stationary EHD1- EEA1-positive vesicles (arrows). (D) Example of motile EHD1- EEA1-positive vesicle that is losing EEA1 during the time-lapse (arrowhead) and stationary EHD1- EEA1-positive vesicles (arrows). (E) Example of presumed fusion of EEA1-positive vesicle with EHD1-positive vesicle (image is magnified 2× comparing to images A–D). (F) Quantification of colocalization of EHD1-positive stationary and motile vesicles with EEA1-positive stationary and motile vesicles (n=357). EHD1 alone shown in white, EHD1+EEA1 shown in black (G) Quantification of colocalization of all EEA1-positive stationary and motile vesicles with EHD1-positive stationary and motile vesicles. EEA1 alone are shown in white, EEA1+EHD1 are shown in black. (H–J) Fluorescence intensity changes in EHD1- EEA1-positive stationary vesicles. Examples of line traces of single vesicles EHD1 (cyan) and EEA1 (red) fluorescence intensity over 10 minute time lapse (10 seconds interval between frames). (H) Example of a line trace of fluorescence intensity of vesicle where neither EHD1 nor EEA1 changed their intensity. (I) Example of a vesicle where EEA1 fluorescence intensity diminished while EHD1 remained constant. (J) Example of vesicle where EHD1 intensity diminished while EEA1 intensity was constant.

