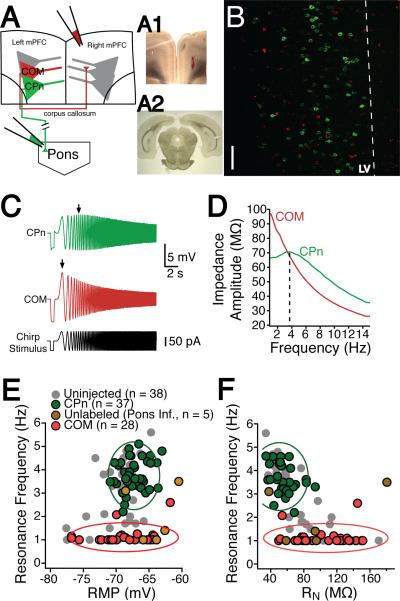
Figure 2. Dynamics of mPFC neurons depend upon their long-range projection targets.
(A) Schematic of dual infusion strategy. Retrograde beads were infused into contralateral mPFC and/or the ipsilateral pyramidal tracts/pons. (A1) 300 μm coronal thick slice containing the contralateral mPFC infusion site (A2) Ipsilateral pyramidal tract infusion site in a 50 μm coronal section. (B) Distribution of commissural (COM) and corticopontine (CPn) neurons. COM and CPn neurons are two non-overlapping populations. CPn neurons (green) form a band at the upper parts of layer V (LV). COM neurons are interspersed throughout layer V in close proximity to CPn neurons as well as in more superficial layers. Scale bar is 50 μm (C) In response to a 15-s, 15 Hz Chirp stimulus, CPn neurons (green) resonate at a much higher frequency than COM neurons (red). (D) A comparison of the impedance amplitude profile (ZAP) of COM versus CPn neurons. (E) Overlay of the resonance profiles plotted against membrane potential and (F) input resistance. Neurons were either labeled by the pyramidal tract/pontine infusion (green), neurons that did not get labeled by the pontine pyramidal tract/pontine infusion (gold), COM neurons labeled from the contralateral infusion (red). For comparison, unlabeled neurons from Figs 1C&D are shown in grey. Clusters boundries (dashed lines) were found using mean cluster analysis and represent the standard deviation around each cluster.

