
Figure 3.
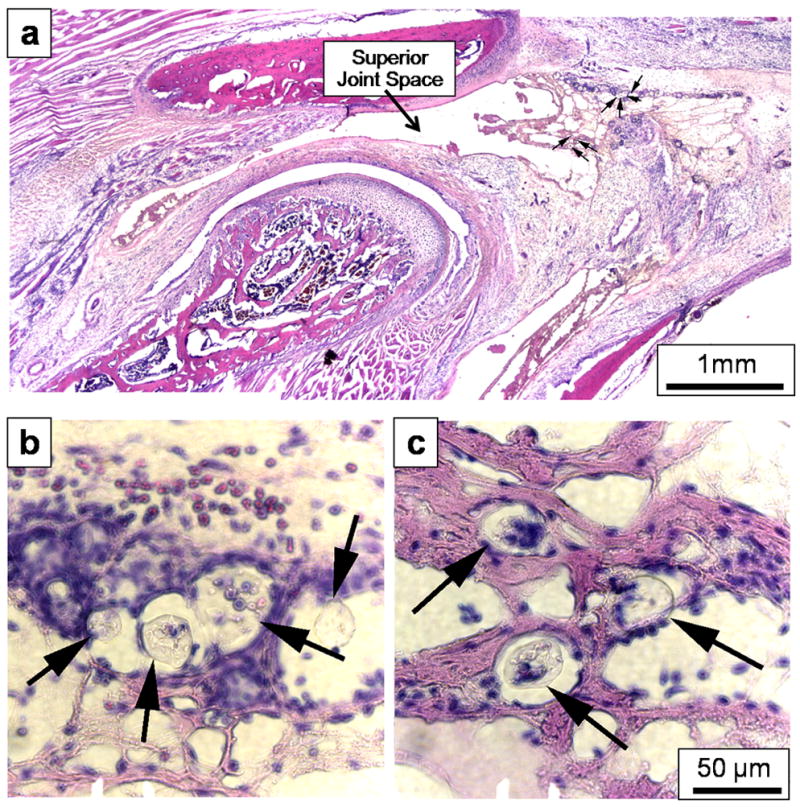
Representative images from the 30 mg/mL PLGA group indicating (a) the location of the PLGA MPs (arrows), which were primarily embedded within the synovial tissue lining the posterior surface of the superior joint space, adjacent to the TMJ vasculature. The specific MPs identified in (a) are shown at higher (40×) resolution in (b) and (c), again indicated by arrows. The MPs were surrounded by inflammatory cells (blue nuclei), but were too large to be engulfed by these cells. All histological sections shown were stained with hematoxylin and eosin. The 50 μm error bar in (c) also applies to (b). The original magnification of (a) was 2.5×.