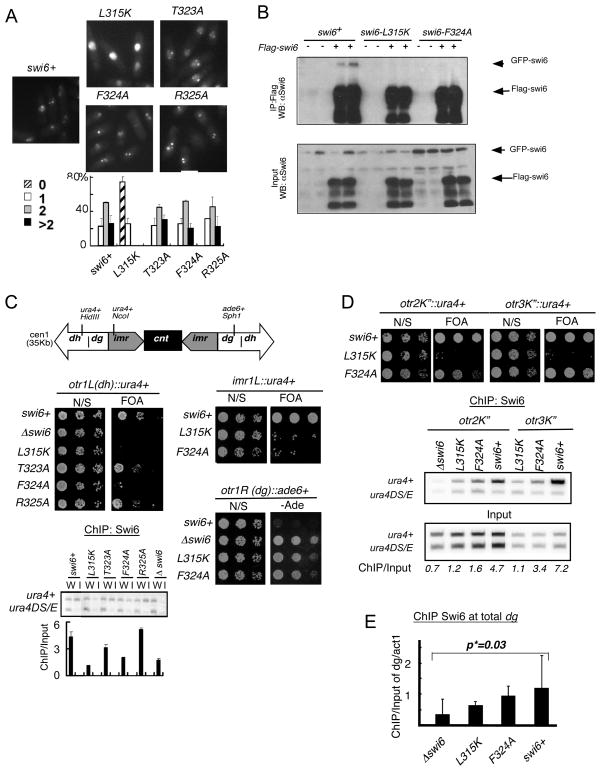
Fig 3. Characterization of Swi6 mutations in vivo.
(A) Visualization of Swi6-GFP foci in live cells. Quantification of GFP foci results of wild type (FY3386), swi6-L315K (FY3388), swi6-T323A (FY3389), swi6-F324A (FY 3390) and swi6-R325A (FY3391), showing fraction of cells with 0, 1, or ≥2 foci. 100 cells were counted and repeated three times independently. (B) Dimerization in vivo of mutant forms of Swi6. GFP-swi6 integrated cells were transformed with either pREP81X-Flag or pREP81X Flag-Swi6 plasmids containing the same version of Swi6, and grown in selected medium. Soluble protein was immunoprecipitated with FLAG M2-agarose conjugated beads. Coimmunoprecipitation was detected by western blotting with anti-Swi6 antibodies. Two transformed colonies were tested in each mutant. (C) Silencing of the ura4+ or ade6+ marker in the cen1 dh, imr or dg repeats (indicated by the schematic). Expression in different swi6 mutants was determined by sensitivity to FOA or viability on adenine-minus medium. N/S, non selective (Uracil+) medium. Swi6 localization in the cen1 dh repat was measured by chromatin immunoprecipitation (ChIP) using primers to detect an integrated ura4+ marker compared to a ura4-DS/E minigene that contains an internal deletion, which is located at the normal (euchromatic) locus. The same primers detect both ura4-DS/E and ura4+. W: Input; I: IP. Swi6-F324A localization at cen1(dh) is significantly lower than wild type, with a p value of 0.048. (D) Expression of ura4+ marker in cen2 or cen3 dg repeat in different swi6 mutants was determined by sensitive to FOA. Swi6 localization at cen2 dg or cen3 dg was performed as in (C), with the indicated significance values. (E) Swi6 localization in different mutants at global dg was measured by ChIP using total dg primers compared to act1. Swi6-F324A is lower but not significant than wild-type. Statistical analysis compared 3 independent experimental samples using Student t test.

