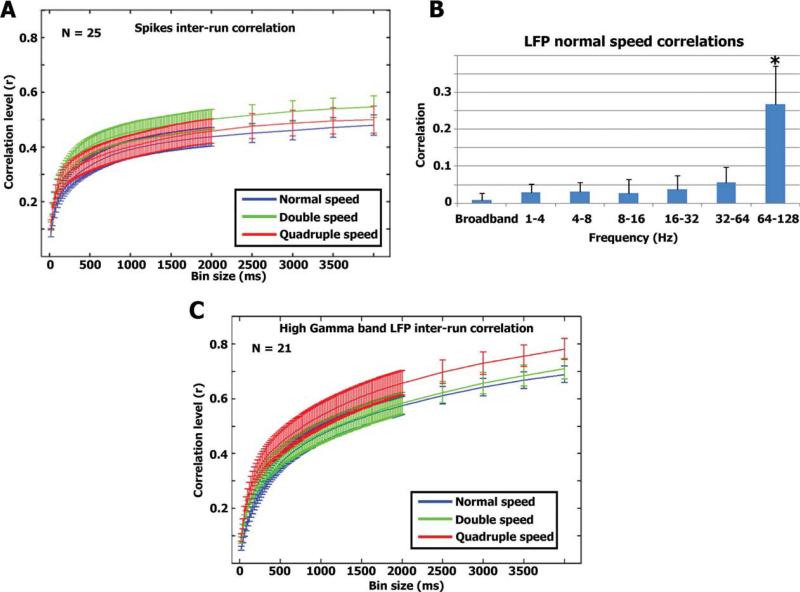
Figure 2.
(A) Correlation vs. smoothing—spikes. For each neuron we calculated the correlation between the two smoothed spike trains in each modulation rate (see Methods). The graph represents the average correlation values of 25 neurons and error bars denote standard error of the mean across all neurons. (B) LFP responses. Correlation between repeated runs was also evaluated for the LFPs at different frequencies (see Methods). Significant correlations were seen only in the high γ-band. The bars represent the average correlation and standard deviation across 21 LFP channels. (C) Similar to A, we calculated the degree of inter-run correlation as a function of smoothing level for the high gamma band LFPs.

