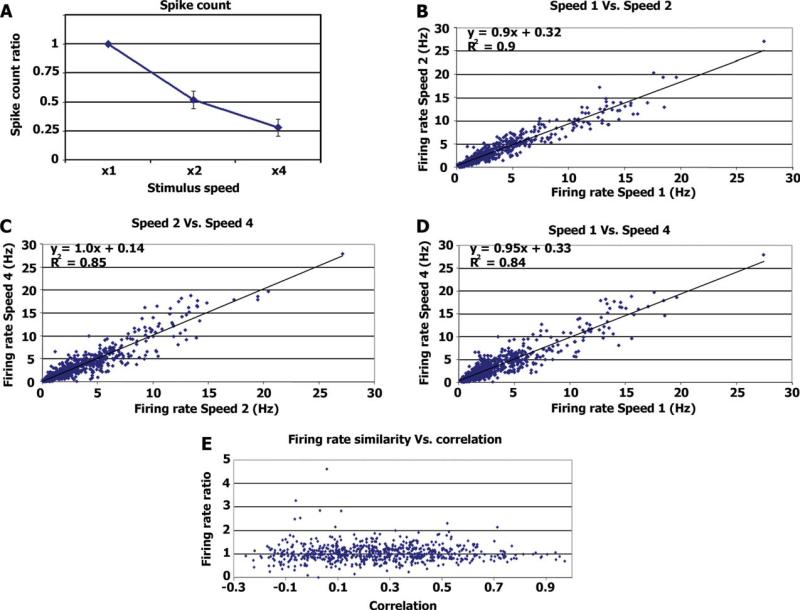
Figure 3.
Firing rate invariance. (A) Average spike count ratio. Average ratio between the number of spikes emitted during the different stimulus modulation rates and the number of spikes emitted during normal speed stimulation. For speed × 1 the value is 1 by definition. (B) Each dot represents the firing rate during a 20-s segment (x-axis) plotted against the firing rate of the same neuron during the corresponding 10 s of the double speed stimulation (y-axis). The regression line and r values are in the top left corner. (C) Same as B, comparing the firing rate during 10-s segments of double speed stimulation with the firing rate during the corresponding 5 s of the quadruple speed stimulation. (D) Same as B and C comparing 20 s of the normal speed with the corresponding 5 s of the quadruple speed. (E) Ratio of firing rate vs. correlation level. For each time segment, we calculated the ratio of firing rate between normal and double speed and plotted it against the correlation level between the two normal speed runs (see Methods). [Color figure can be viewed in the online issue, which is available at www.interscience.wiley.com.]

