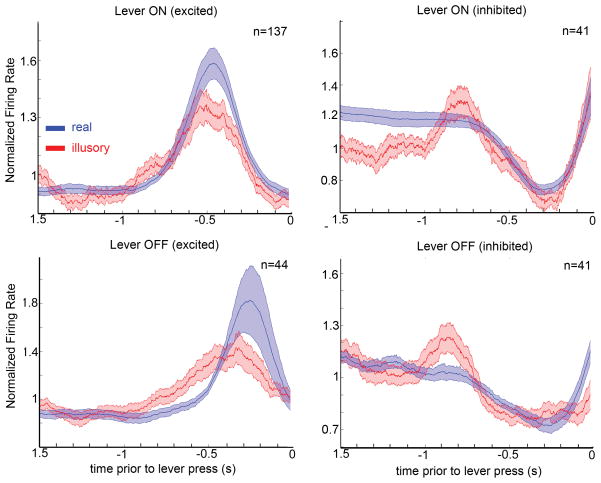
Figure 3.
Population average. Average firing rate preceding lever presses signaling real (blue) and illusory (red) transitions, normalized to the average firing rate for each cell. The population was divided between cells that were excited (left column) or inhibited (right column) by target onset (top row) or target offset (bottom row). Thick lines represent the average, and shaded area represents one standard error from the mean.

