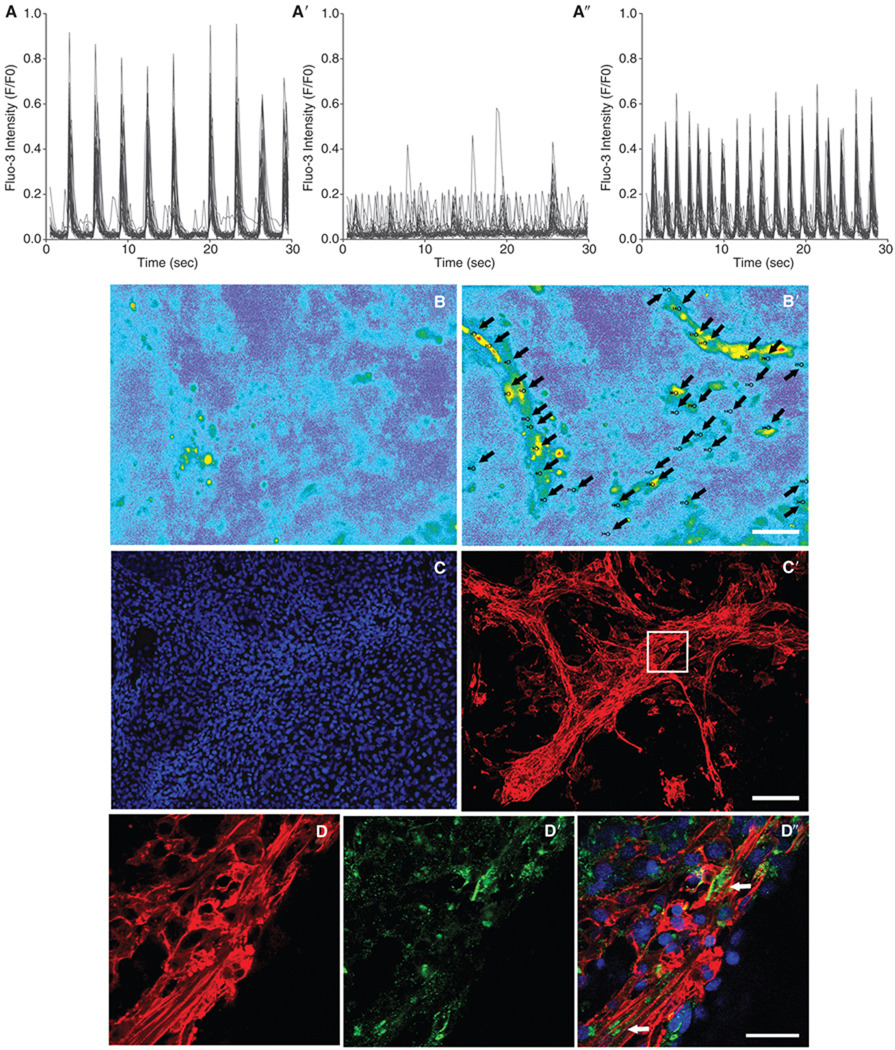
FIG. 4.
Representative images demonstrating spontaneous calcium (Fluo-3) oscillations in P19 cell-derived cardiomyocytes after 12 days of culture. (A–A″) Heptanol effect on the coordinated contractions of differentiated P19 cells (N = 7). (A) Spontaneous beating areas showing rhythmic intracellular calcium fluctuations. (A′) This rhythmic contraction was lost immediately after exposure to heptanol. (A″) After washing, rhythmic intracellular calcium fluctuations quickly returned. (B–B′) Frame scan of typical spontaneous beating areas with regions of interest marked (arrows). Proximally 30 regions of interest were marked for each experiment. (B) Before contraction. (B′) During contraction. (C–C′) The same cells used previously to analyze calcium fluctuations expressed cardiac troponin-T. (C) Nuclei stained with DAPI (blue). (C′) Cardiac troponin-T. (D–D″) Higher magnification confocal images of the area indicated by the inset in (C′) illustrating connexin43 expression among cardiac troponin-T-positive cells. (D) Cardiac troponin-T. (D′) Connexin43. (D″) Nuclear counterstaining with DAPI (blue) in the merged image. Arrows indicate regions with greater quantity of connexin43 among P19 cell-derived cardiomyocytes. Scale bars: B = 50 µm; C =100 µm; and D = 20 µm.

