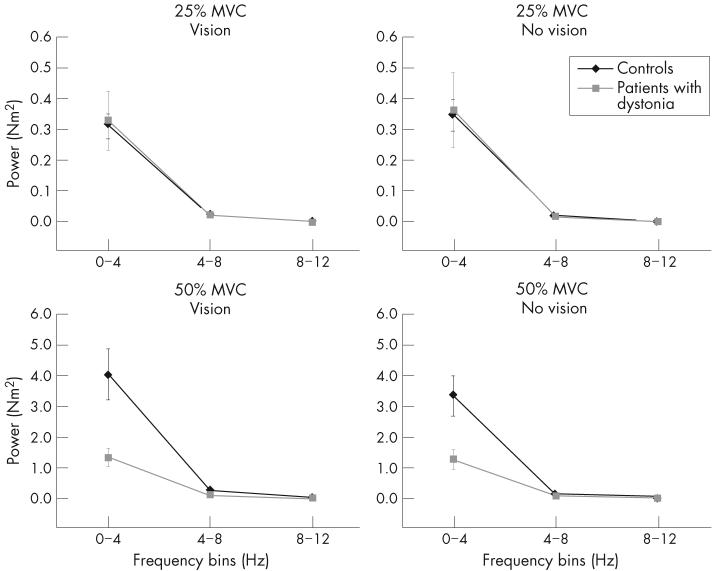
Figure 4.
Average spectral power of the force signal for the 25%-maximum voluntary contraction (MVC; top panels) and 50%-MVC force target (bottom panels) under conditions of vision (left panels) and no vision (right panels) in the 0-4-Hz, 4-8-Hz and 8-12-Hz frequency bins. Controls are shown as black lines and diamonds and patients with dystonia as grey lines and squares. Values are mean (SE). The scale of the y axis is different at the different force targets.

