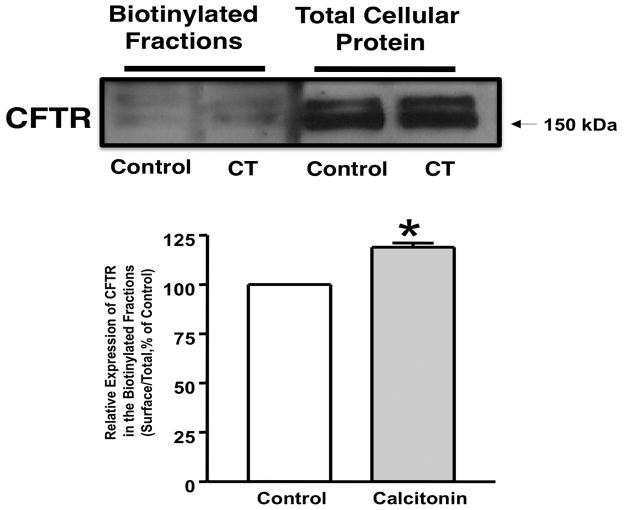
Figure 6. CT increased CFTR level on apical membrane.
T84 cells were plated in transwells. Cells were treated with CT (10 nM) or vehicle for 20 min in PBS. Cells were then subjected to biotinylation at 4°C utilizing sulfo-NH-SS-biotin. Biotinylated proteins were extracted with streptavidin-agarose, and surface and total fractions were run on 8% SDS-polyacrylamide gel. The blot was immunostained with rabbit anti-CFTR antibody. Representative blots of 3 separate experiments are shown. Quantification data from densitometric analysis are shown from three different experiments. Values are expressed as % of control and represent Mean ± SE. *P<0.05

