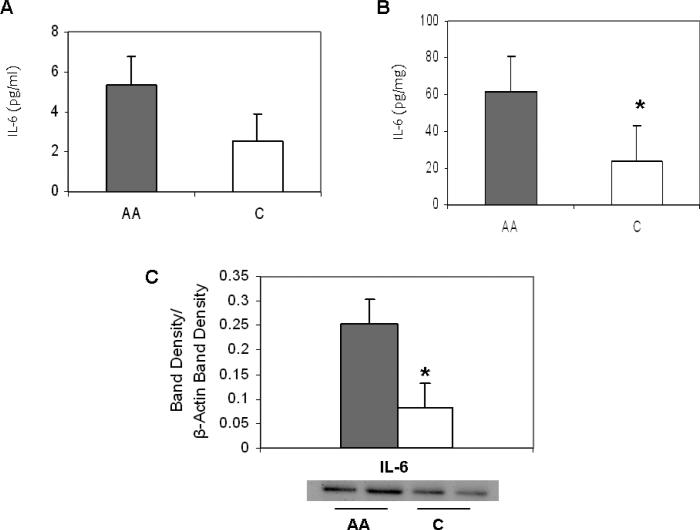
Figure 2.
Racial differences in Interleukin-6 (IL-6) levels. A. African American (AA) and Caucasian (C) human plasma. B. Basal HUVEC culture, AA and C. Values normalized to protein content. C. IL-6 protein expression levels in AA (shaded) and C (open) basal HUVEC culture. ImageJ densitometric analysis of bands expressed in relation to β–actin. Bars show mean ±SE. *P<0.05 between ethnic group.

