Figure 1.
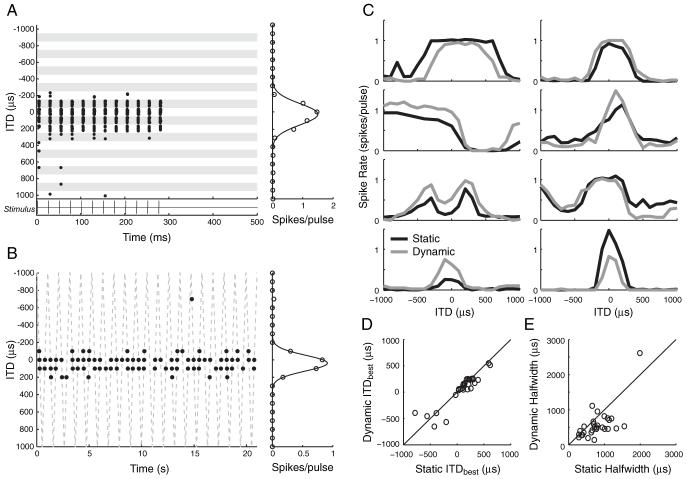
Responses to static- and dynamic-ITD stimuli in the same neurons show similar ITD tuning. A, B, Left, Spike raster displays for responses to static and dynamic ITD stimuli in the one neuron. Right, Mean spike rates as a function of ITD. A, Response of a neuron to the static-ITD stimulus (stimulus shown under spike raster). Each row in the raster shows the spike time in response to one presentation of a 40 pps pulse train. ITD is varied in blocks of 10 trials indicated by shading. B, Response of neuron in A to the dynamic-ITD stimulus. The dashed line shows instantaneous values of ITD as it sweeps periodically between -1000 and +1000 μs. The abscissa of each dot indicates the spike time re. stimulus onset, whereas the ordinate indicates the ITD of the immediately preceding stimulus pulse. C, Rate-ITD tuning for static-ITD (black lines) and dynamic-ITD (gray lines) stimuli measured in eight different single neurons. D, Scatter plot of ITDbest in neurons with peak- or trough-shaped ITD tuning for static- and dynamic-ITD stimuli (n = 29 neurons). E, Scatter plot of half-widths for same neurons as in D.

