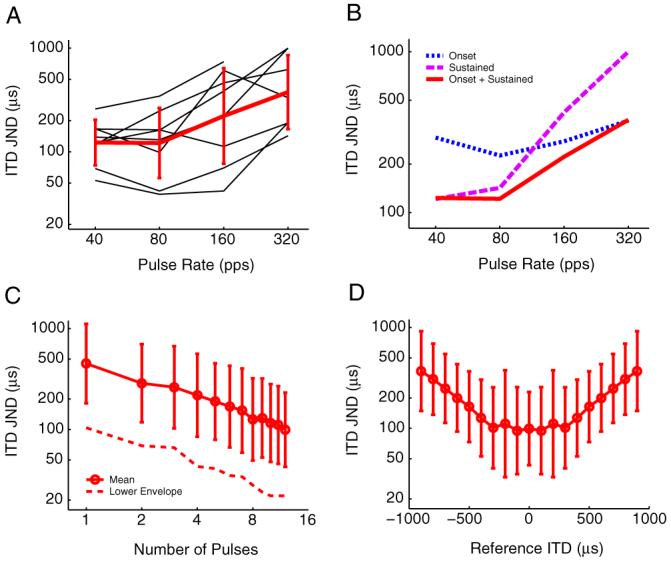
Figure 8.

Neural ITD discrimination thresholds. A, ITD JND from 0μs is as a function of pulse rate for eight single neurons (thin black lines). Mean JND across neurons increases with pulse rate (thick red line). Error bars show ±1 SD. B, The first 50 ms of the response (onset response) is analyzed separately from the remaining 250 ms of the response (sustained response). C, ITD thresholds as a function of the number of stimulus pulses in a 40 pps pulse train. Mean ITD JNDs drop linearly on a log-log scale. Error bars show ±1 SD. The dotted line shows the lower envelope of the ITD thresholds from individual neurons (n = 22). D, Neural ITD JNDs as a function of reference ITD. Mean thresholds are best with in the physiological range of ITD(±300 μs) and get worse at increasing ITD offsets.
