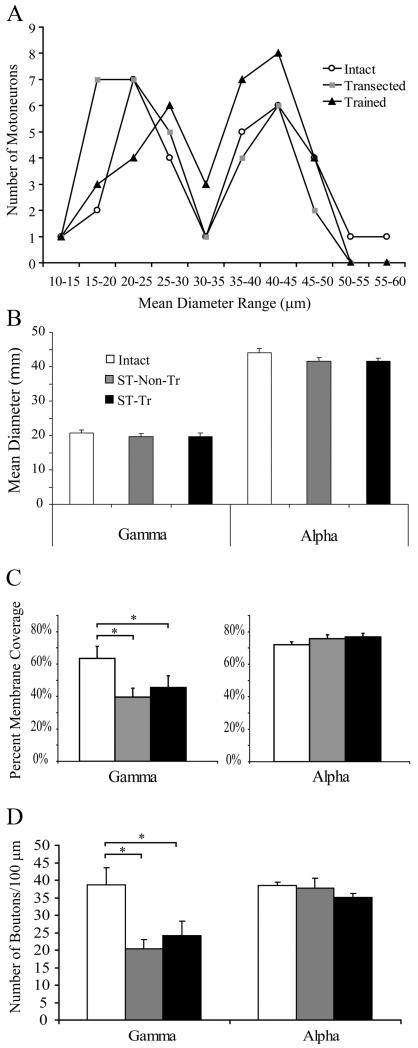
Figure 1.
Distribution of all MNs based on mean diameter (μm), including intermediary diameter range, which was excluded from synaptology analysis. A, Note the bimodal distribution with a clear trough at the 30–35 μm range for all groups. B, There were no significant differences in the mean diameter of γ- or α-MNs between the three groups. C, D, The total soma membrane synaptic coverage and number of boutons significantly decreased for γ-MNs after transection injury with and without step training, but were unchanged between all groups for α-MNs. *p < 0.05.

