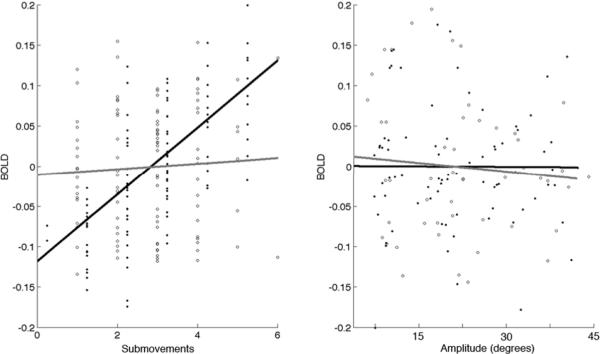
Figure 3.
Correlation of number of submovements (left) and movement amplitude (right) with BOLD signal intensity derived from a .5cm diameter sphere centered in the left GPi/STN (MNI coordinates: 14, −18, −6). BOLD intensity values (% change in signal, center meaned) were derived from model estimates and beta values in one representative subject. Note strong interaction of number of submovements and BOLD in viscous challenge task (black line) but not the target challenge task (grey line).

