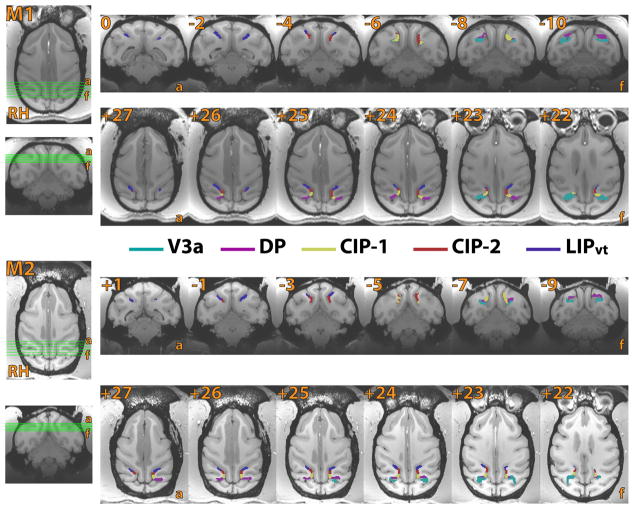
Figure 3.
Area boundaries of V3a, DP, CIP-1, CIP-2, LIPvt of M1 and M2 in coronal and axial sections. Coronal (top) and axial (bottom) sections for monkey M1 (top) and M2 (bottom) slice segments. Reference images are displayed on the left side, illustrating the coverage of each coronal and axial slice. Borders were defined on the surface, projected into the volume, and color-coded by area.

