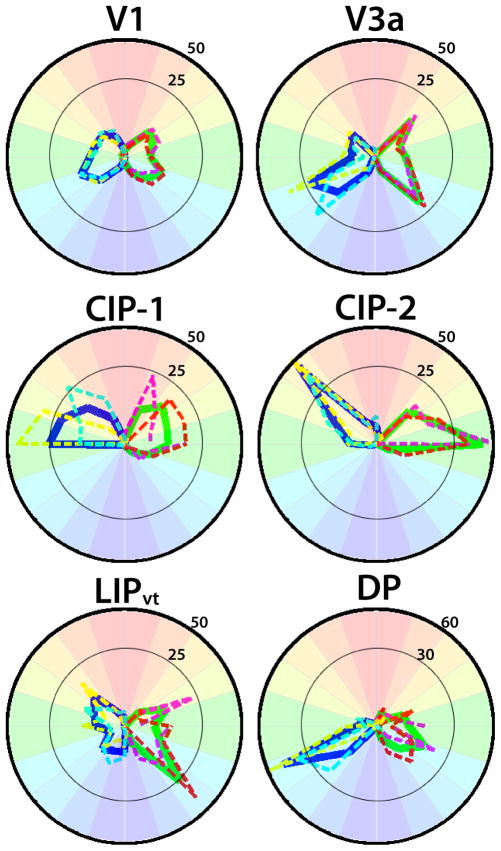
Figure 5. Visual field representations in areas V1, V3a, DP, CIP-1, CIP-2, and LIPvt.
Polar angle plots based on polar angle maps thresholded at 2 s of the cycle S.E.M. variance (see Methods). The percentage of visual field coverage within each area was calculated for both monkeys individually and then averaged. Dashed lines correspond to visual field coverage for individual monkeys (M1: yellow RH, purple LH; M2 light blue RH, red, LH). The solid lines correspond to the average visual field coverage (RH: blue; LH: green). All areas almost exclusively represented contralateral visual space with little variance in visual field representation between the two monkeys.

