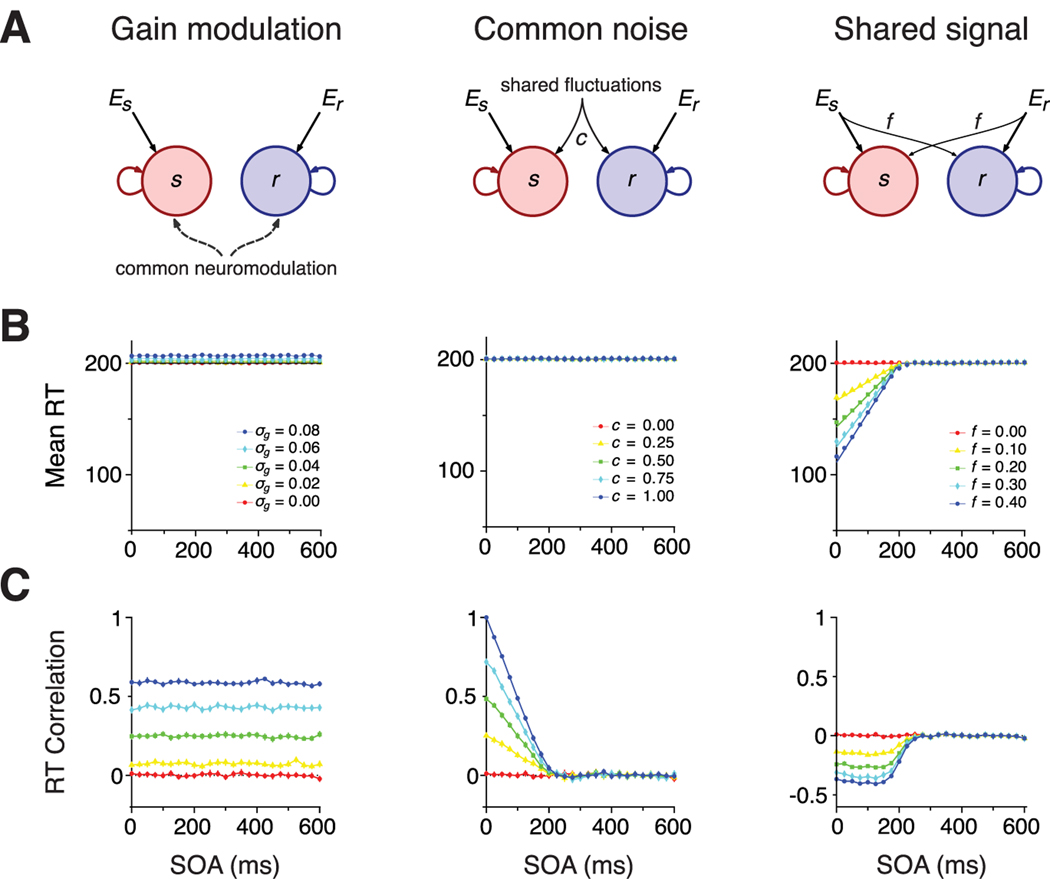
Figure 3.
Predictions of models with effector nonspecific interactions. A, Schematics of the models. B, Mean RTs versus SOA, for different values of the relevant parameters of each model (see Materials and Methods for interaction between integrators). For the model with common gain modulation (left), each curve corresponds to different values of variance of the intertrial gain variance, ; for the common noise model (middle), curves correspond to different fractions c of shared fluctuations (Eq. 7), whereas for the shared signal model (right), curves are parameterized by the fraction f of the external input that originates from the signal of the counterparts (Eq. 8). In all these models, mean SRT and RRT are equal. C, RT correlation versus SOA. Color codes as in B. The parameters of the integrator units are τ = 100 ms, α = 1, c = 0, f = 0, and σg = 0, unless stated otherwise in the subpanels.

