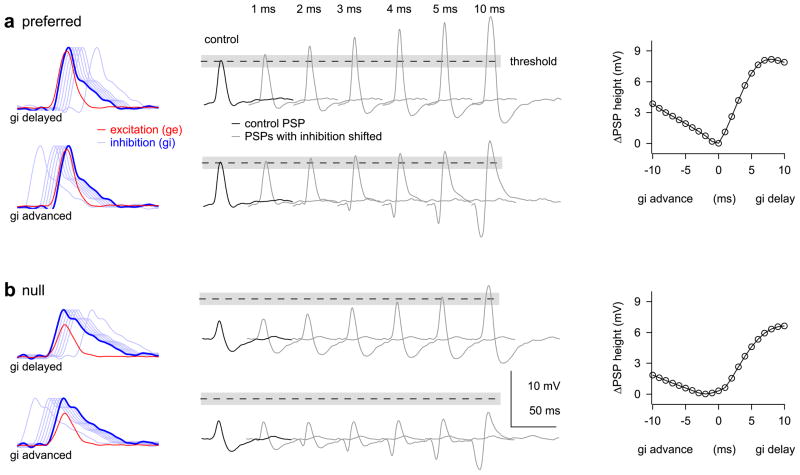
Figure 2.
Cell 1: temporal shifts of inhibition affect PSP height. Left: conductance waveforms, red for excitation, blue for inhibition. Middle: computed PSPs, black for control, gray for shifted inhibition. Dashed ± gray line is spike threshold ± SD. Right: change in PSP height plotted against the time shift of inhibition. (a) Preferred. Every temporal shift of inhibition increased PSP height. Since firing probability was ~ 70%, any increase in PSP height would likely increase firing probability. (b) Null. The control PSP was so far from spike threshold, that large delays of inhibition (4 – 5 ms) would be needed to evoke spikes.

