
Figure 3.
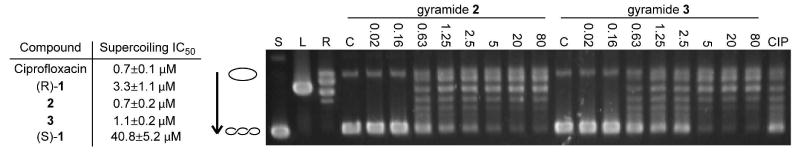
Inhibition of DNA gyrase supercoiling activity by 1-3. The table summarizes the IC50 values for ciprofloxacin and gyramides (R)-1, 2, 3, and (S)-1. A representative gel obtained from the analysis of the inhibition of DNA gyrase supercoiling activity is shown. The open circle graphic represents relaxed closed circular DNA, the coiled graphic signifies supercoiled DNA, and the arrow shows the direction of increased mobility of supercoiled DNA states. Supercoiled (‘S’), linear (‘L’), and relaxed (‘R’) pUC19 controls are labeled above the lanes. Gel data for assays with 2 and 3 are shown (in μM); the label ‘C’ indicates the lane for the solvent control. The lane labeled ‘CIP’ represents treatment with 0.7 μM ciprofloxacin, which is the IC50 for ciprofloxacin in our assay.