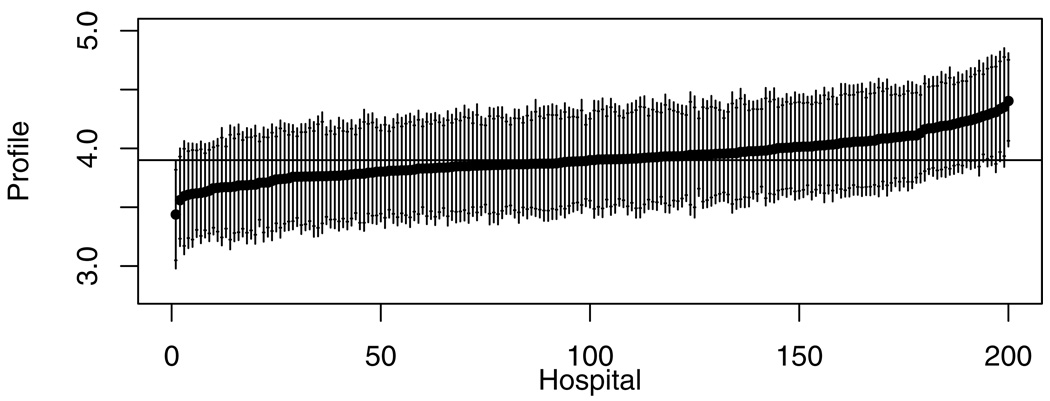
Figure 1.
Profiling results for 30-day survival using the reference method, with hospitals ordered by estimated profile for survival (logit of probability of survival for patient with mean covariate values). The horizontal bar represents the median of the posterior distribution of provider profile. Each line segment represents the 95% posterior interval, with short horizontal line segments for the limits of the 90% posterior interval.

