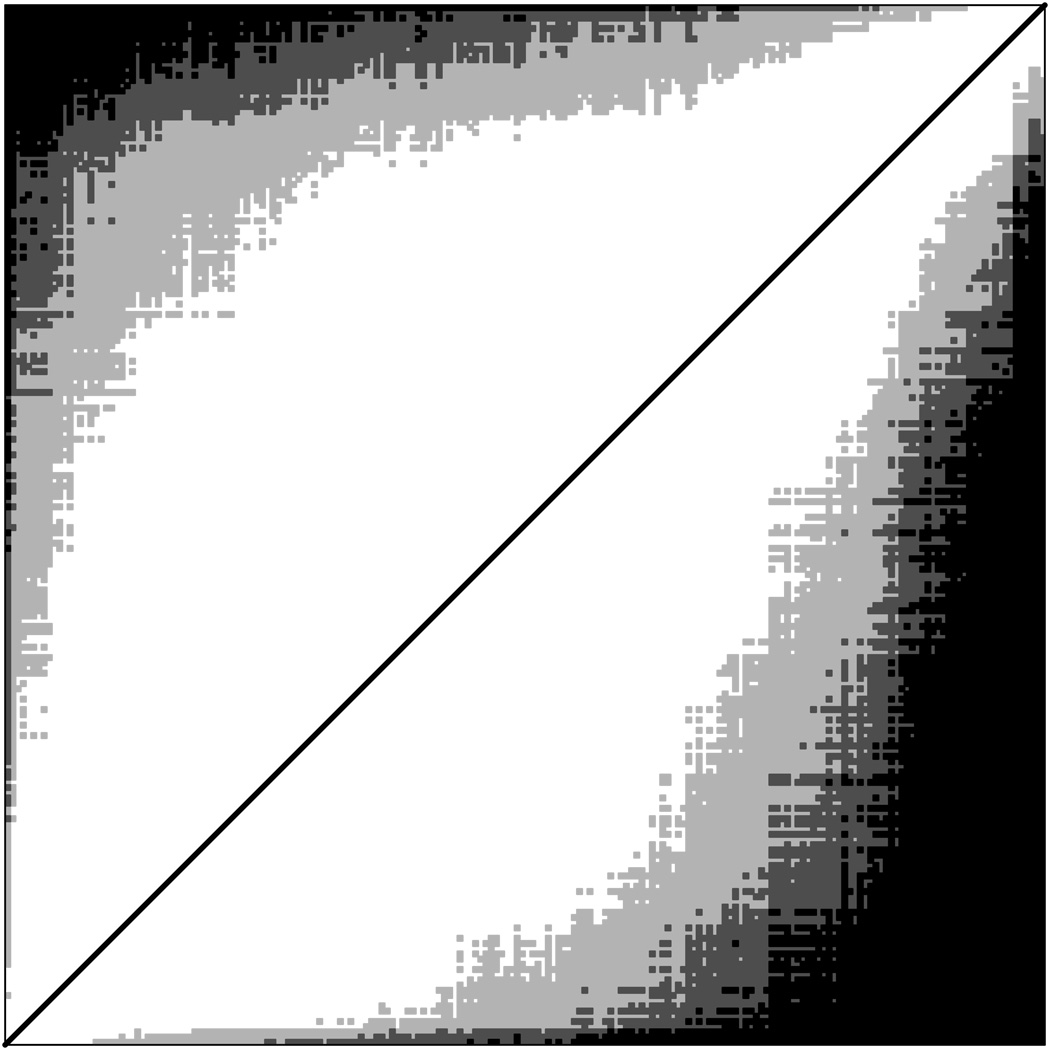
Figure 2.
Significant pairwise comparisons of hospital profiles. Triangle above diagonal is for reference method, below diagonal is for weighted method 2. In each triangle, hospitals are ordered by posterior median profile. Black squares indicate pairs for which ordering of profiles is >95% certain, dark gray squares indicate pairs for which ordering is between 90% and 95% certain, and light gray squares indicate pairs for which ordering is between 80% and 90% certain. The white area adjacent to diagonal represents pairs whose profiles are not sufficiently different to be ordered with probability >80%.

