
Figure 2. The expressions of Twist and IL-6 are up-regulated in HCC cancer stem cells.
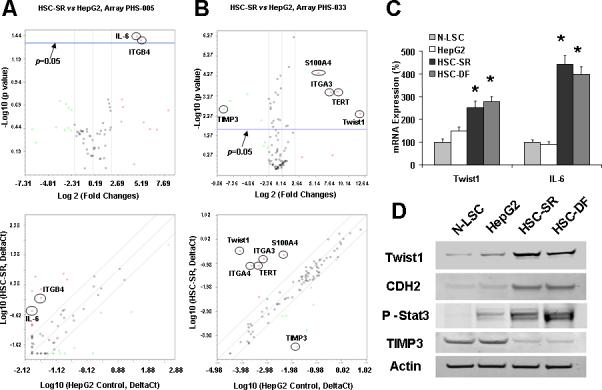
Panel A&B: Relative gene expression profile between HSC stem cells (HSC-SR) vs. HepG2 cells is shown. The expression of a panel of diverse cancer-associated genes was evaluated by real-time polymerase chain reaction (PCR) using Human Cancer & Estrogen Receptor Signaling PCR Array(#PAHS005, Panel A) as well as Cancer Pathway Finder PCR Array (#PAHS033, Panel B) from SABioscience Corporation (Frederick, MD). Gene expression relative to glyceraldehyde-3-phosphate dehydrogenase was plotted as the Volcano Plots, depicting the relative expression levels (Log2) for selected genes in HSC-SR versus HepG2 control panels (Panel A&B, Top). The relative expression levels and p values for each gene in the related samples were also plotted against each other in the scatter plot (Panel A&B, Bottom). IL-6 and Twist are the most upregulated genes among the ten cancer signaling pathways in HCC stem cells. Panel C: Total RNA was extracted from N-LSC, HepG2, HSC-SR, HSC-DF cells and Twist and IL-6 mRNA expressions were assessed by quantitative real-time PCR. The relative mRNA expression was normalized to expression of N-LSC as percentage of control. *p<0.05 when compared with mRNA expression of N-LSC and HepG2 cells. Panel D: The expression of phosphor-Stat3, Twist and downstream protein N-Cadherin CDH2) is up-regulated in HSCs. Western blots of cell lysates were performed and sequentially probed with antibodies against Twist, P-Stat3, CDH2 and beta-actin as a loading control in hepatocytes and HCC stem cells as indicated. Representative immunoblots are shown.