
Figure 4. HCC stem cells are resistant to conventional chemotherapy.
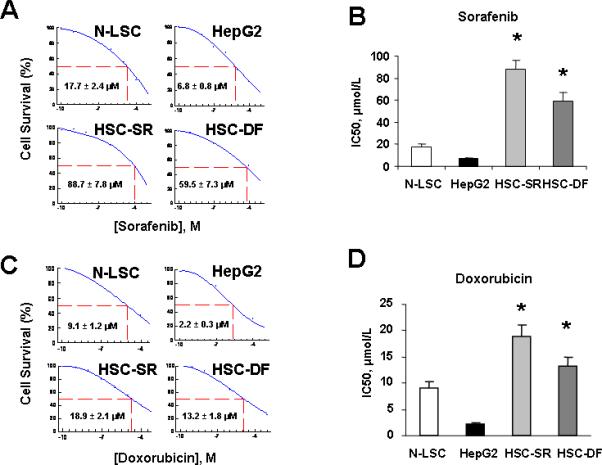

Panel A&C: After serum starvation of cultured cells overnight, sorafenib and doxorubicin were added at various concentrations (10-3M to 10-10M) and cell viability was assessed after 72 hours. IC50 graph of high-content image analysis of human hepatocytes and HCC stem cells treated by sorafenib and Doxorubicin was illustrated. Quantitative data of MTS assay in the sorafenib treated cells were calculated for IC50 with XLfit software, which is marked in the middle of the box. Panel B&D: IC50 of sorafenib and doxorubicin in hepatocytes and HCC stem cells is illustrated in bar graph. HCC stem cells under either self renewal (HSC-SR) or differentiation (HSC-DF) are more resistance to sorafenib and doxorubicin than HepG2 cells and normal liver stem cells. IC50 results are expressed as the mean ± S.E. of eight different experiments. Panel E: Groups of 5 SCID Berge mice were selected 8 to 10 weeks old per treatment group. The human HSC-SRs (1,000) as well as parental HCC cells (5 × 10⁶) were injected subcutaneously and allowed to engraft for 10 days. At day 10 the tumor was visible, and then the doxorubicin treatment was started and the mice received the desired concentration of the drug intra-peroteneal 3 times per week for 14 days. At the end of the 14 days the tumor was dissociated into single cell suspension and assayed with Almar Blue to determine percent inhibition of the drug. Panel F&G: Differential expression of CD133 and let-7a in vivo following treatment with doxorubicin by real-time PCR is shown. Data represent percentage change in expression in doxocibicin treated tumors compared with controls. * p<0.05 relative to controls.