
Figure 6. microRNA let-7 is involved in the HCC stem cell resistance to chemotherapy.
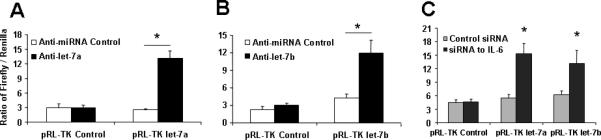

Panel A&B: To validate the efficacy of the anti-let-7 inhibitor, HCC stem cells plated (2 × 10⁶ cells/well) in 6-well plates were transfected with 1 μg of pRL-TK let-7a or let-7b (firefly luciferase construct), 1 μg of pRL-TK (Renilla luciferase construct), and either anti-let-7a (Panel A), anti-let-7b (Panel B) or control inhibitor. Luciferase assays were performed 48 h after transfection. The anti-let-7a (anti-let-7b) inhibitor directly blocked the effect of endogenous let-7a (let-7b) on the luciferase reporter. Panel C: siRNA to IL-6 or control was transfected with 1 μg of pRL-TK let-7a or let-7b (firefly luciferase construct), 1 μg of pRL-TK (Renilla luciferase construct). Dual-luciferase assay has demonstrated that silencing IL-6 significantly increased the miRNA expressions of let-7 family. Panel D&E: Human hepatocytes and HCC stem cells were seeded in a 96-well plate and incubated with different concentrations of sorafenib. The MTS assays were performed 72 hours after treatment. The data were expressed as percentage of control group. The IC50 values were calculated with Excel XLFit program and marked in the middle of the box. Panel D illustrated the detailed IC50 analysis in different cell lines with anti-let-7a treatment whereas Panel E exemplified IC50 results expressed as the mean ± S.E. of eight different experiments. Silencing of let-7a significantly sensitizes HCC cancer stem cells to sorafenib treatment. Panel F&G: The expression of SOCS1 and downstream kinase is regulated by let-7a. Western blots of cell lysates were performed and sequentially probed with antibodies against SOCS1, Caspase-3, phospho and total Stat3, and tubulin as a loading control in HepG2 or HSC-SR cells transfected with let-7a mimics or inhibitors with related controls. Representative immunoblots (Panel F) and quantitative data (Panel G, mean ± standard error) from 4 separate blots are shown.