Fig. 15.
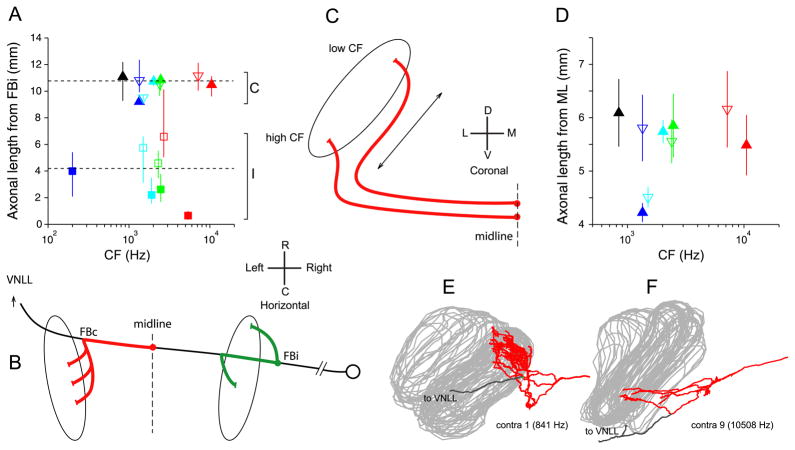
A,B: Differences in path length between ipsi- and contralateral inputs. A: Estimated average and range of lengths for contra- and ipsilateral projections between the first branchpoint (FBi) of the ipsilateral MSO projection and the endpoints. Dashed lines show overall contralateral (C) and ipsilateral (I) mean. B: Schematic of the measurement. The length of the trajectory between midline and contralateral endpoints (red), or between ipsilateral first branchpoint (FBi) and endpoints (green), was measured (same values as in Fig. 13C,D). To estimate the difference in length of contra- and ipsilateral inputs, the red segment needs to be augmented by the distance FBi to midline: we use the average measured on ipsilateral projections (4994 μm, see main text). C–F: Absence of length differences in the innervation from the contralateral ear along the dorsoventral dimension of MSO. C: Hypothetical scheme of innervation by contralateral fibers, suggesting extra length for the most dorsally projecting (low-CF) fibers. If input fibers approach the MSO from ventral, low-CF fibers may have longer axonal length (arrow) to innervate the dorsal part of MSO than high-CF fibers for the ventral part. D: relationship between axonal length from ML to endpoints, and CF. Symbols in A and D indicate average axonal length; lines are range (A) and standard deviation (D) for each projection (symbol color and shape as in Fig. 8). E and F: Coronal view of contralateral projections of fibers with lowest and highest CF (840 and 10508 Hz, respectively).

