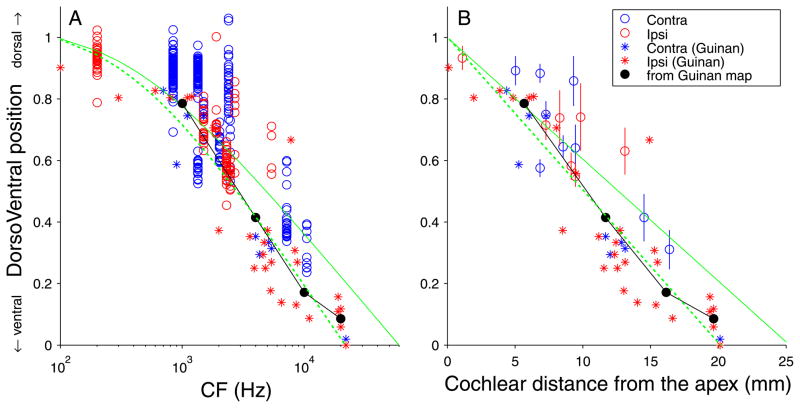
Fig. 9.
Tonotopic compression of low frequencies in MSO. The dorsoventral (DV) location, normalized to the dorsoventral extent of the MSO, is shown for all endpoints (A) of all reconstructed fibers on a logarithmic CF abscissa, and (B) for their mean and standard deviation on a cochlear distance abscissa. Each circle in A indicates a single endpoint (blue: contralateral fiber, red: ipsilateral fiber). The asterisks and the black circles and line show extracellular and summary data from Guinan et al. (1972) (see main text). The green lines are predicted relationships based on the cochlear tonotopic map, based on Greenwood’s formula. The solid green line is the prediction for a full representation of all CFs; the dashed line is for a representation limited to 22 kHz and below. The endpoints at low CFs cluster above the green lines. If low CFs were overrepresented in MSO, those endpoints would be expected to cluster below rather than above the green lines.

