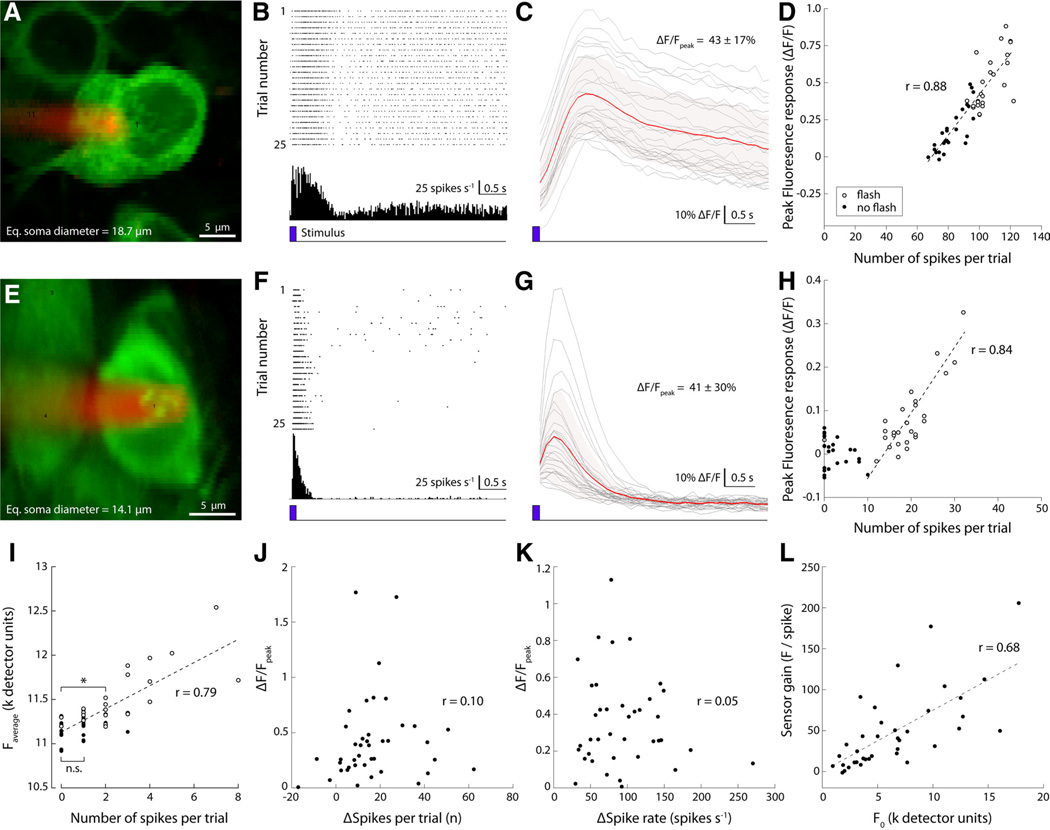
Figure 7. GCaMP3 signal gain and linearity vary across the recorded ganglion cell population.
A, Two-photon image of an extracellularly recorded GCaMP3-expressing retinal ganglion cell (RGC) (green); Alexa Fluor 568-filled pipette (red). B, Raster plot of the response of the cell to stimulation with a brief light flash (458 nm LED; 125 ms duration; 100 µW/cm2) at trial onset (bottom trace, blue). Twenty-five single trial spike trains are shown. C, Change in fluorescence intensity (ΔF/F) recorded simultaneously with the spike responses shown in B (red, average; shaded light red, SEM of average; gray, single trials). D, Average fluorescence change during each trial (5 s duration) plotted against the total number of spikes fired during that trial. Open circles, Trials in which a brief light flash was presented; filled circles, control trials (no light flash). E–H, Results from a different RGC. Note rectification of the GCaMP3 signal at spike counts <10. I, Example of a ganglion cell recording (morphology not shown) with negligible rectification at low spike counts. The fluorescence intensity during trials in which the cell fired two spikes was significantly greater than during trials in which the cell fired no spikes (p = 0.006, t test). The signal difference between trials with no spikes and trials with a single spike was not significant (p = 0.099, t test). Detector units represent the 12 bit fluorescence intensity value signaled by the photomultiplier tube. J, Correlation between the change in number of spikes fired relative to spontaneous rate and peak fluorescence change of the recorded population (n = 42). Each dot represents a single neuron, with the spike count and peak fluorescence change averaged over all recorded trials (4 –30 repeats) (for details, see Results). K, Correlation between change in fluorescence and change in peak spike rate (same data as shown in J). L, Correlation between fluorescence gain (slope of linear fits as shown in D and H) and baseline fluorescence (see text for details).

